| __timestamp | Rockwell Automation, Inc. | Xylem Inc. |
|---|---|---|
| Wednesday, January 1, 2014 | 3869600000 | 2403000000 |
| Thursday, January 1, 2015 | 3604800000 | 2249000000 |
| Friday, January 1, 2016 | 3404000000 | 2310000000 |
| Sunday, January 1, 2017 | 3687100000 | 2856000000 |
| Monday, January 1, 2018 | 3793800000 | 3181000000 |
| Tuesday, January 1, 2019 | 3794700000 | 3203000000 |
| Wednesday, January 1, 2020 | 3734600000 | 3046000000 |
| Friday, January 1, 2021 | 4099700000 | 3220000000 |
| Saturday, January 1, 2022 | 4658400000 | 3438000000 |
| Sunday, January 1, 2023 | 5341000000 | 4647000000 |
| Monday, January 1, 2024 | 5070800000 |
Unlocking the unknown
In the ever-evolving landscape of industrial automation and water technology, Rockwell Automation, Inc. and Xylem Inc. stand as titans. Over the past decade, these companies have navigated the complexities of cost management with varying strategies. From 2014 to 2023, Rockwell Automation's cost of revenue surged by approximately 38%, peaking in 2023. This reflects their aggressive expansion and innovation in automation solutions. Meanwhile, Xylem Inc. experienced a 93% increase in cost of revenue, highlighting their commitment to addressing global water challenges. Notably, 2024 data for Xylem is missing, suggesting potential shifts in their financial strategy. As these companies continue to adapt, their cost management strategies will be pivotal in shaping their future trajectories. This analysis offers a glimpse into the financial dynamics of two industry leaders, providing valuable insights for investors and industry enthusiasts alike.
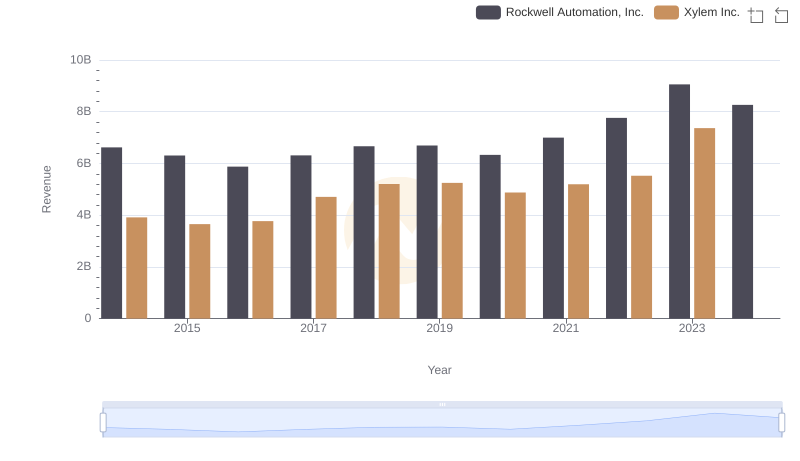
Revenue Showdown: Rockwell Automation, Inc. vs Xylem Inc.
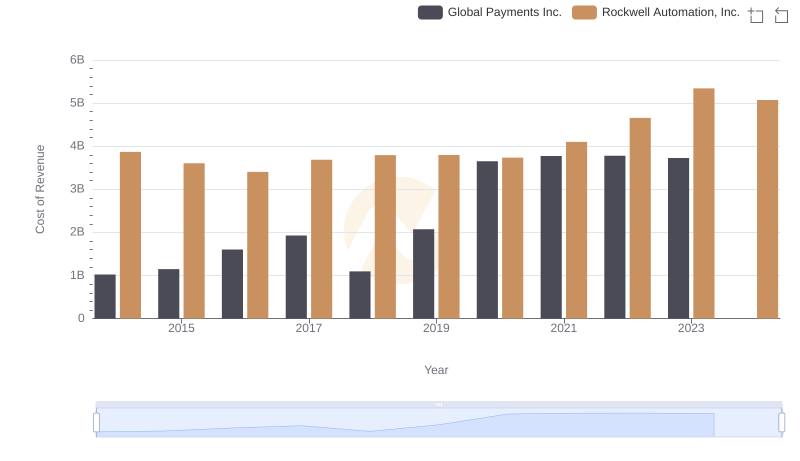
Rockwell Automation, Inc. vs Global Payments Inc.: Efficiency in Cost of Revenue Explored
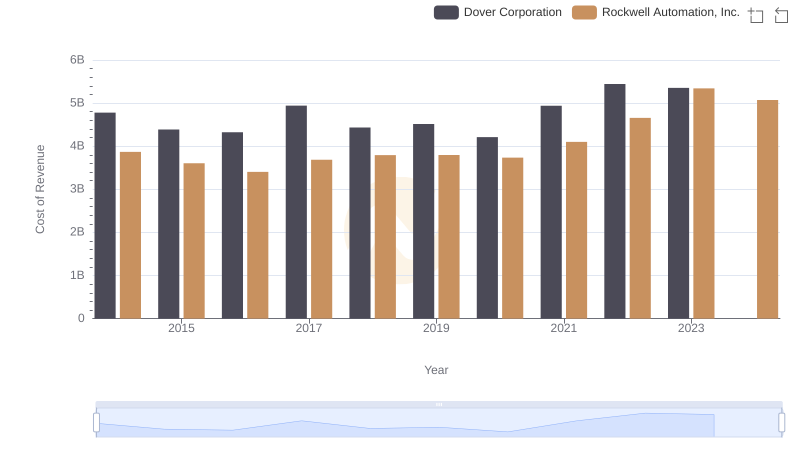
Analyzing Cost of Revenue: Rockwell Automation, Inc. and Dover Corporation
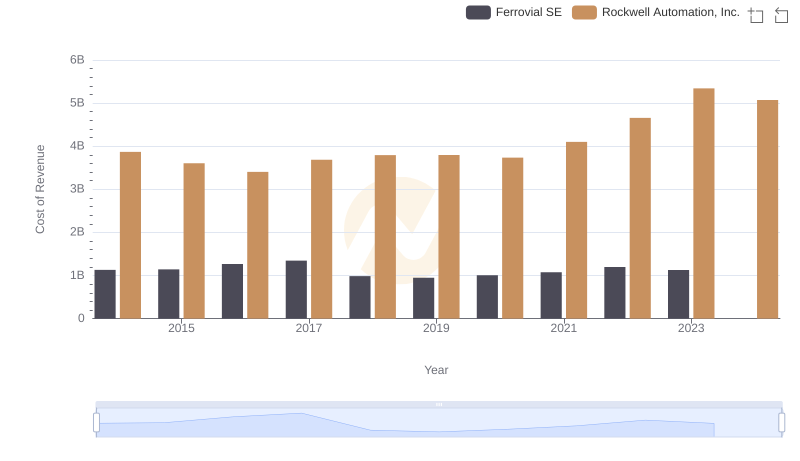
Comparing Cost of Revenue Efficiency: Rockwell Automation, Inc. vs Ferrovial SE
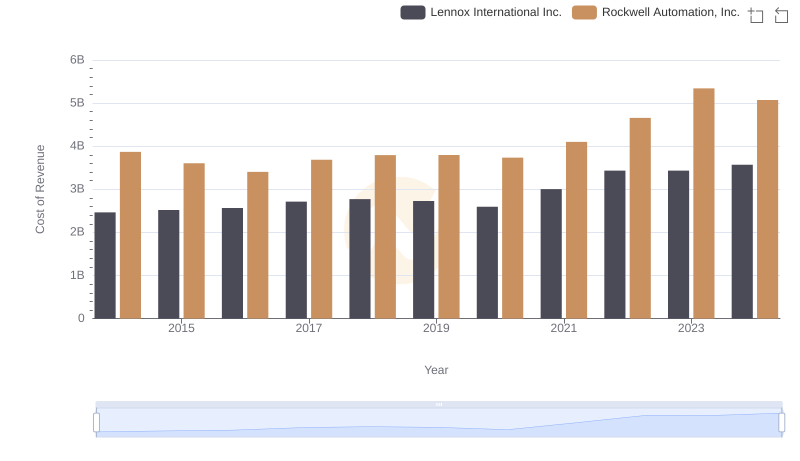
Cost of Revenue Trends: Rockwell Automation, Inc. vs Lennox International Inc.
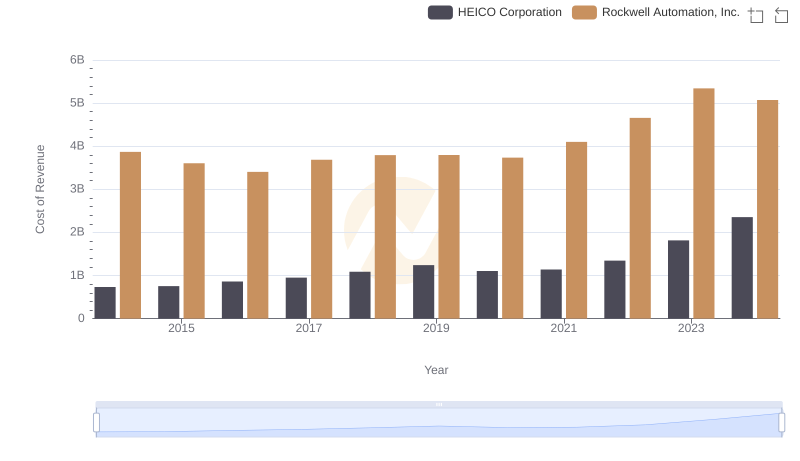
Analyzing Cost of Revenue: Rockwell Automation, Inc. and HEICO Corporation
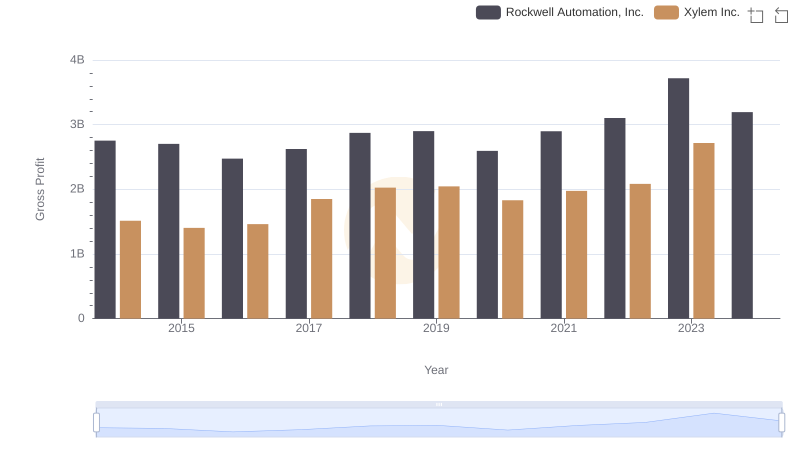
Gross Profit Comparison: Rockwell Automation, Inc. and Xylem Inc. Trends
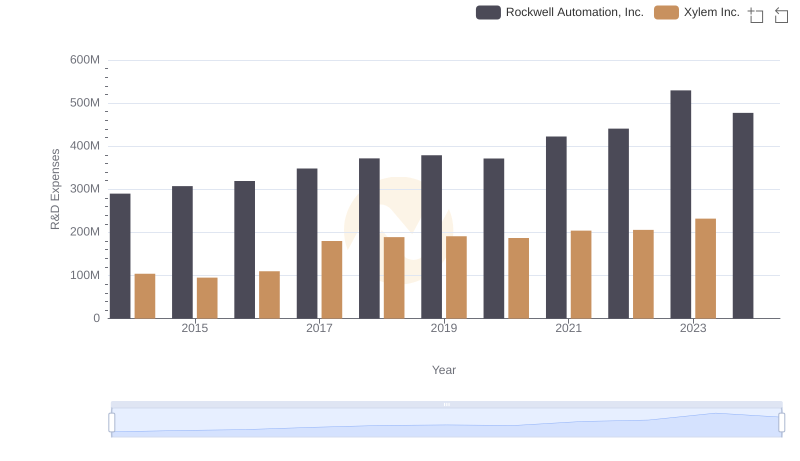
Analyzing R&D Budgets: Rockwell Automation, Inc. vs Xylem Inc.
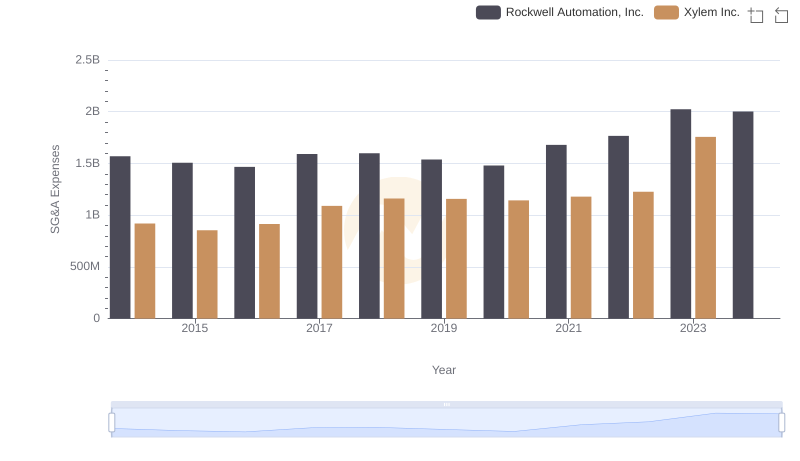
Who Optimizes SG&A Costs Better? Rockwell Automation, Inc. or Xylem Inc.
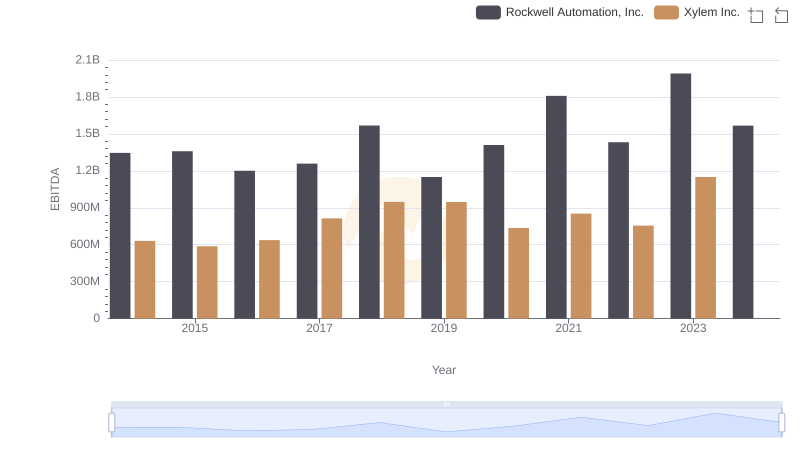
Professional EBITDA Benchmarking: Rockwell Automation, Inc. vs Xylem Inc.