| __timestamp | Rockwell Automation, Inc. | Xylem Inc. |
|---|---|---|
| Wednesday, January 1, 2014 | 2753900000 | 1513000000 |
| Thursday, January 1, 2015 | 2703100000 | 1404000000 |
| Friday, January 1, 2016 | 2475500000 | 1461000000 |
| Sunday, January 1, 2017 | 2624200000 | 1851000000 |
| Monday, January 1, 2018 | 2872200000 | 2026000000 |
| Tuesday, January 1, 2019 | 2900100000 | 2046000000 |
| Wednesday, January 1, 2020 | 2595200000 | 1830000000 |
| Friday, January 1, 2021 | 2897700000 | 1975000000 |
| Saturday, January 1, 2022 | 3102000000 | 2084000000 |
| Sunday, January 1, 2023 | 3717000000 | 2717000000 |
| Monday, January 1, 2024 | 3193400000 |
Unleashing insights
In the ever-evolving landscape of industrial automation and water technology, Rockwell Automation, Inc. and Xylem Inc. have been pivotal players. Over the past decade, Rockwell Automation has consistently outperformed Xylem in terms of gross profit, showcasing a robust growth trajectory. From 2014 to 2023, Rockwell's gross profit surged by approximately 35%, peaking in 2023. In contrast, Xylem's growth, while steady, was more modest, with a 79% increase over the same period.
The data for 2024 is incomplete, indicating potential shifts in the market dynamics. As these industry giants continue to innovate, their financial trajectories will be crucial for investors and stakeholders alike.
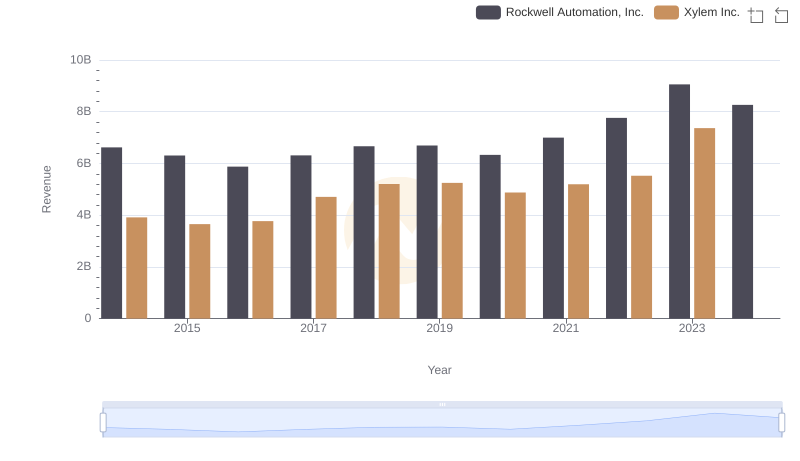
Revenue Showdown: Rockwell Automation, Inc. vs Xylem Inc.
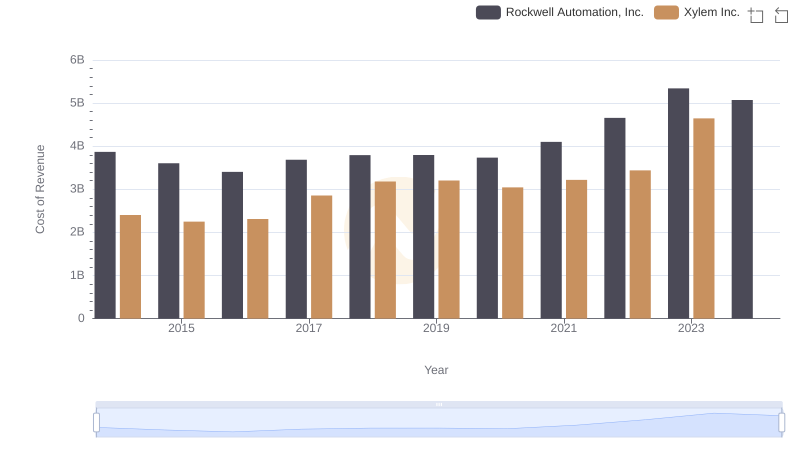
Analyzing Cost of Revenue: Rockwell Automation, Inc. and Xylem Inc.
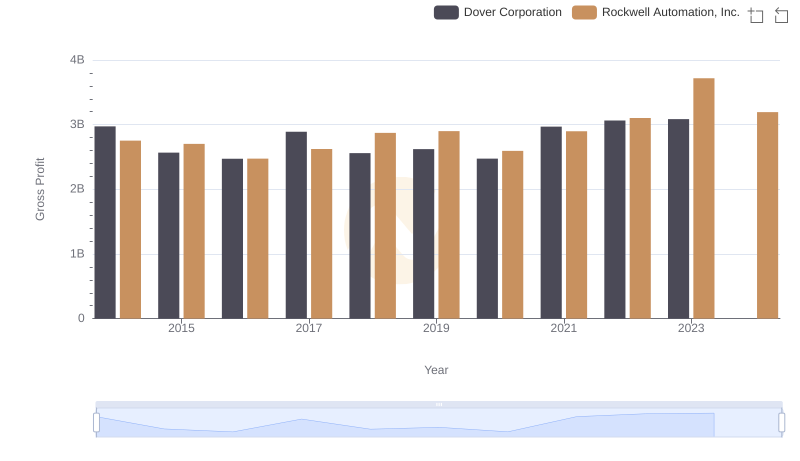
Gross Profit Analysis: Comparing Rockwell Automation, Inc. and Dover Corporation
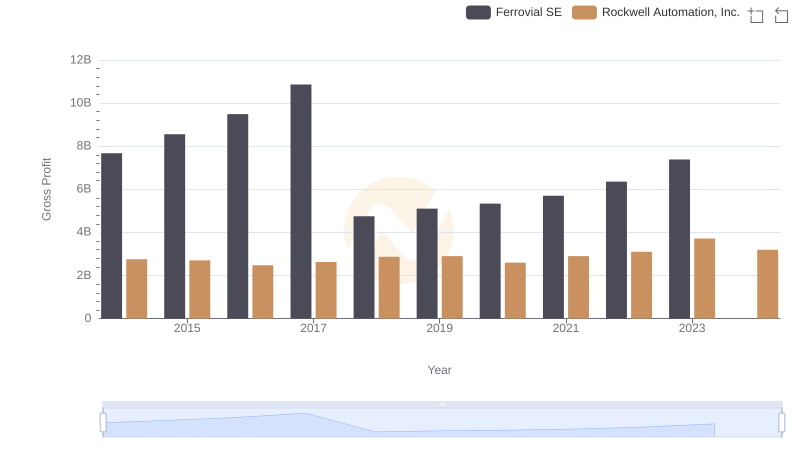
Key Insights on Gross Profit: Rockwell Automation, Inc. vs Ferrovial SE
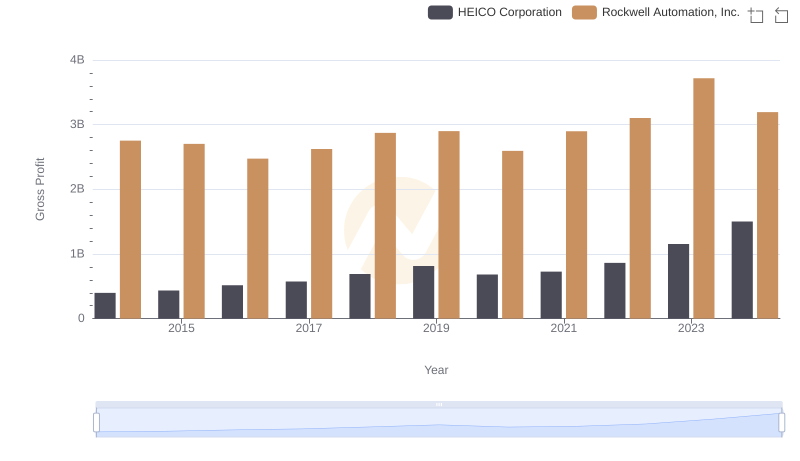
Gross Profit Analysis: Comparing Rockwell Automation, Inc. and HEICO Corporation
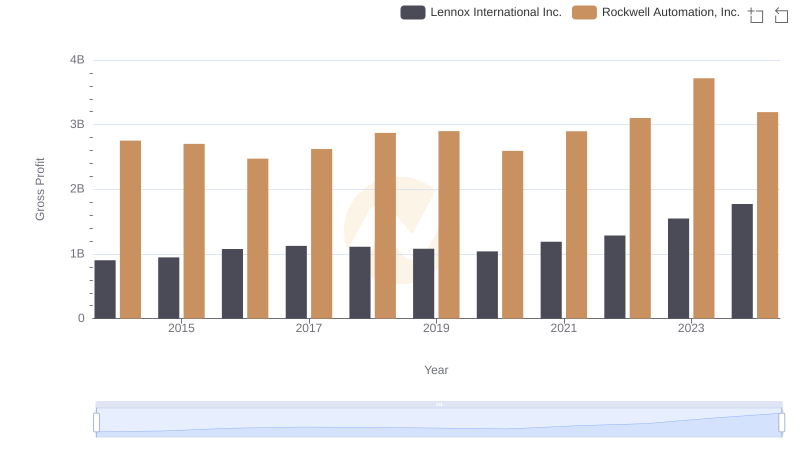
Rockwell Automation, Inc. vs Lennox International Inc.: A Gross Profit Performance Breakdown

Key Insights on Gross Profit: Rockwell Automation, Inc. vs Hubbell Incorporated
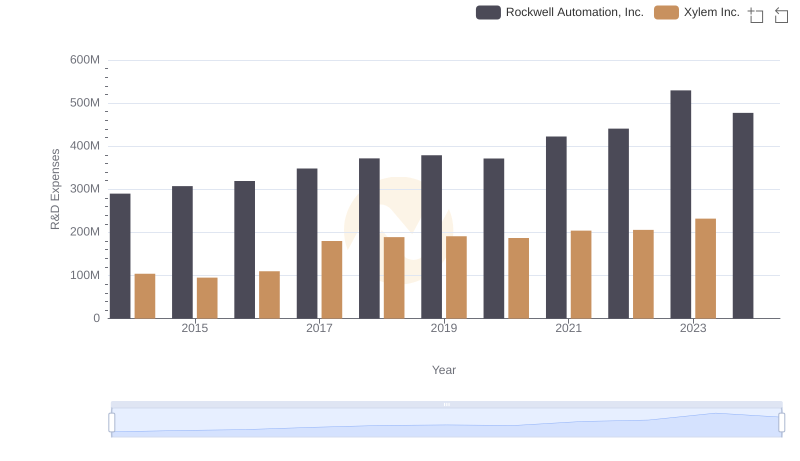
Analyzing R&D Budgets: Rockwell Automation, Inc. vs Xylem Inc.
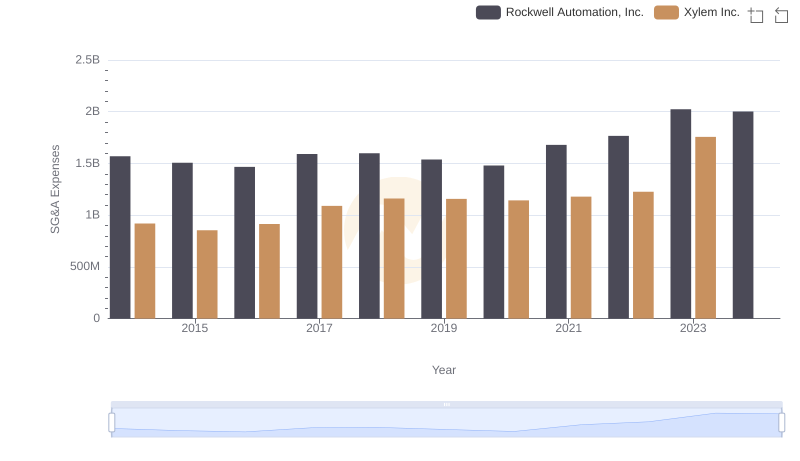
Who Optimizes SG&A Costs Better? Rockwell Automation, Inc. or Xylem Inc.
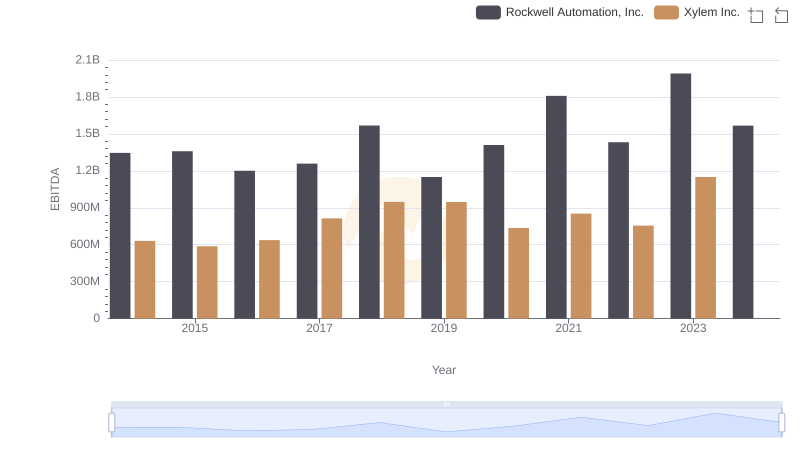
Professional EBITDA Benchmarking: Rockwell Automation, Inc. vs Xylem Inc.