| __timestamp | Johnson Controls International plc | Parker-Hannifin Corporation |
|---|---|---|
| Wednesday, January 1, 2014 | 3125000000 | 1832903000 |
| Thursday, January 1, 2015 | 2209000000 | 1861551000 |
| Friday, January 1, 2016 | 2338000000 | 1558088000 |
| Sunday, January 1, 2017 | 4280000000 | 1846306000 |
| Monday, January 1, 2018 | 2741000000 | 2382235000 |
| Tuesday, January 1, 2019 | 2466000000 | 2513468000 |
| Wednesday, January 1, 2020 | 2572000000 | 2431500000 |
| Friday, January 1, 2021 | 3907000000 | 3092383000 |
| Saturday, January 1, 2022 | 3474000000 | 2441242000 |
| Sunday, January 1, 2023 | 3678000000 | 4071687000 |
| Monday, January 1, 2024 | 2800000000 | 5028229000 |
Cracking the code
In the competitive landscape of industrial manufacturing, Parker-Hannifin Corporation and Johnson Controls International plc have been pivotal players. Over the past decade, these companies have showcased varying trajectories in their EBITDA performance. From 2014 to 2024, Parker-Hannifin's EBITDA surged by approximately 175%, peaking in 2024, while Johnson Controls experienced a more modest growth of around 14% over the same period.
Parker-Hannifin's impressive growth, particularly in 2023 and 2024, highlights its strategic initiatives and market adaptability. In contrast, Johnson Controls, despite a strong start in 2014, faced fluctuations, with its highest EBITDA recorded in 2017. This divergence underscores the dynamic nature of the industry and the importance of innovation and strategic foresight.
As these giants continue to evolve, their financial journeys offer valuable insights into the broader trends shaping the industrial sector.
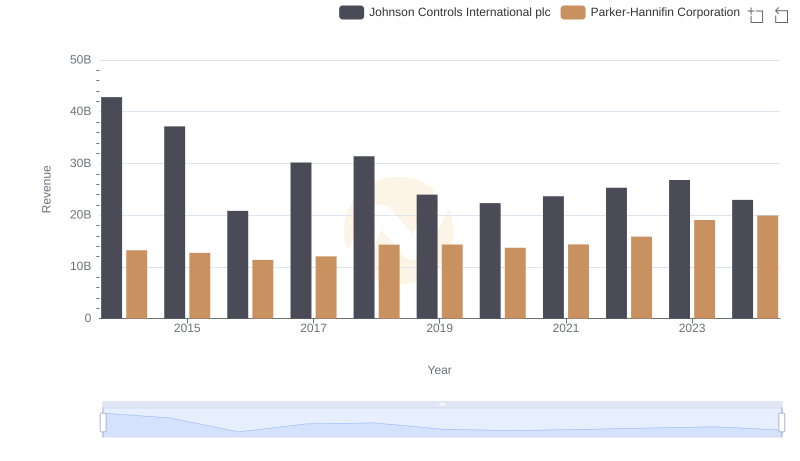
Who Generates More Revenue? Parker-Hannifin Corporation or Johnson Controls International plc
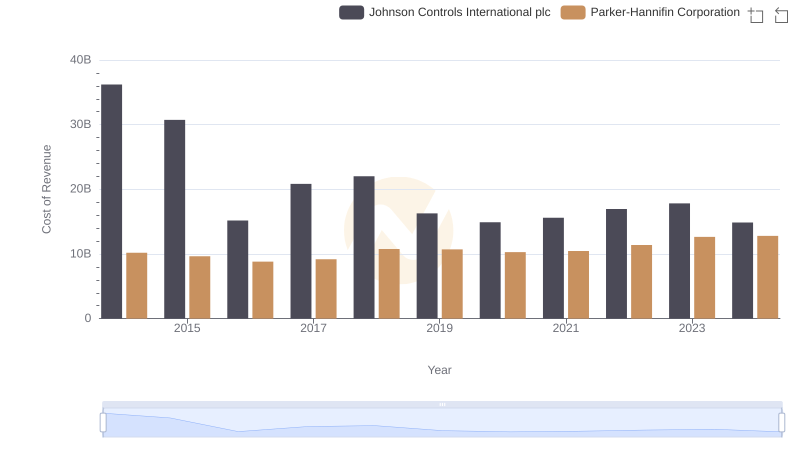
Cost of Revenue Comparison: Parker-Hannifin Corporation vs Johnson Controls International plc
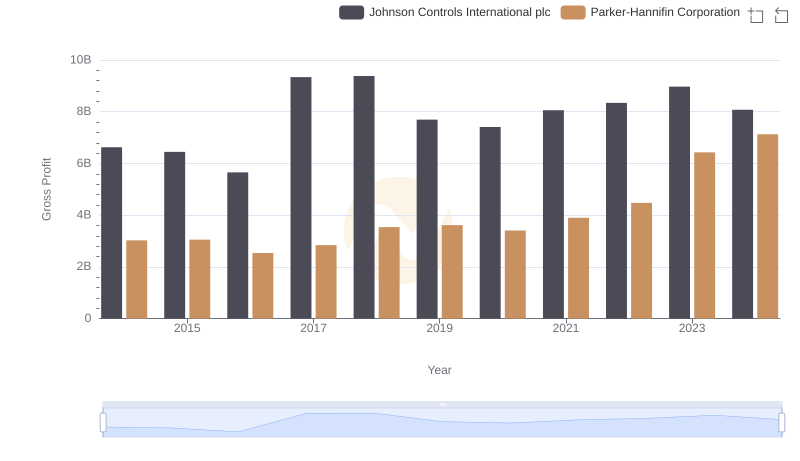
Gross Profit Comparison: Parker-Hannifin Corporation and Johnson Controls International plc Trends
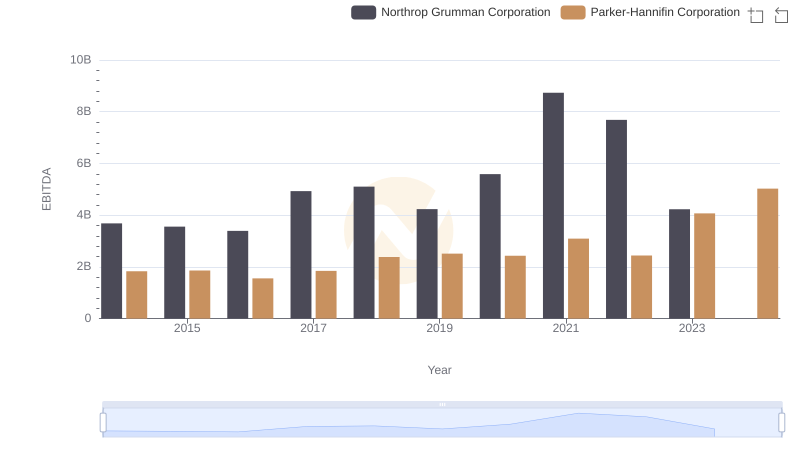
A Side-by-Side Analysis of EBITDA: Parker-Hannifin Corporation and Northrop Grumman Corporation
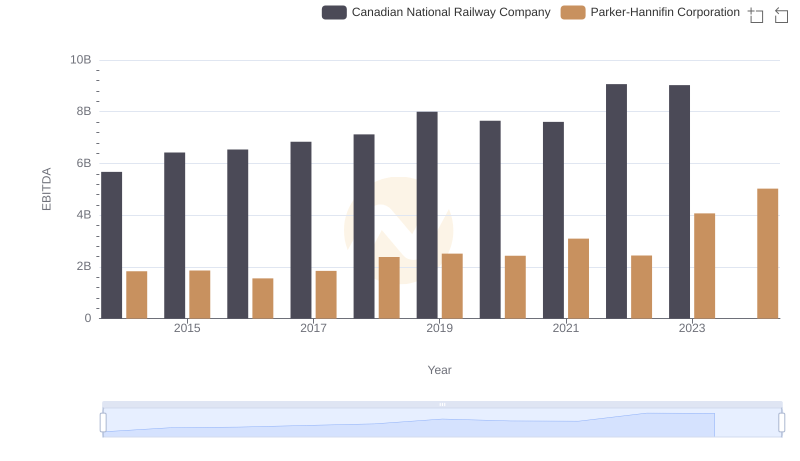
A Side-by-Side Analysis of EBITDA: Parker-Hannifin Corporation and Canadian National Railway Company
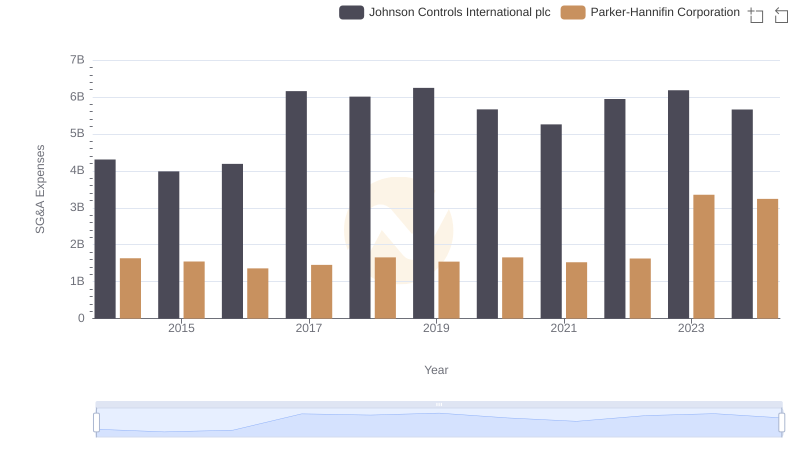
Parker-Hannifin Corporation or Johnson Controls International plc: Who Manages SG&A Costs Better?

A Professional Review of EBITDA: Parker-Hannifin Corporation Compared to Norfolk Southern Corporation
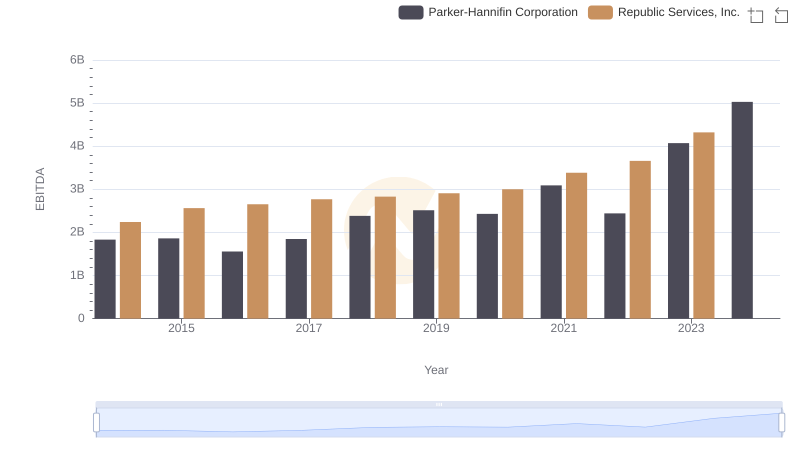
Comprehensive EBITDA Comparison: Parker-Hannifin Corporation vs Republic Services, Inc.

EBITDA Metrics Evaluated: Parker-Hannifin Corporation vs Roper Technologies, Inc.
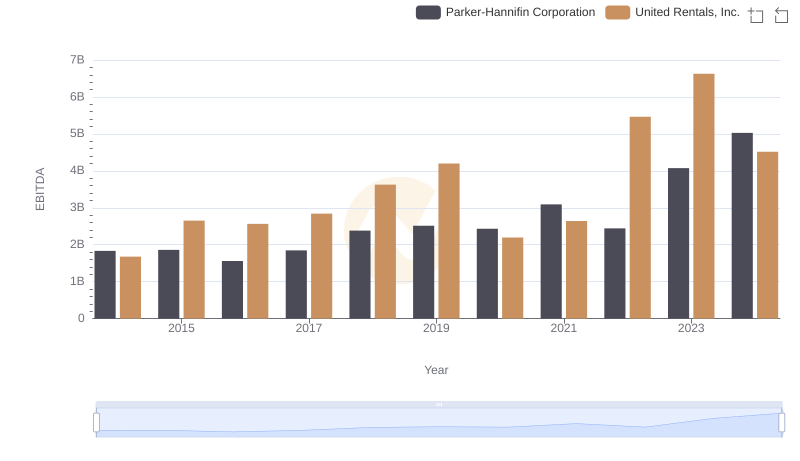
A Professional Review of EBITDA: Parker-Hannifin Corporation Compared to United Rentals, Inc.