| __timestamp | Canadian National Railway Company | Parker-Hannifin Corporation |
|---|---|---|
| Wednesday, January 1, 2014 | 5674000000 | 1832903000 |
| Thursday, January 1, 2015 | 6424000000 | 1861551000 |
| Friday, January 1, 2016 | 6537000000 | 1558088000 |
| Sunday, January 1, 2017 | 6839000000 | 1846306000 |
| Monday, January 1, 2018 | 7124000000 | 2382235000 |
| Tuesday, January 1, 2019 | 7999000000 | 2513468000 |
| Wednesday, January 1, 2020 | 7652000000 | 2431500000 |
| Friday, January 1, 2021 | 7607000000 | 3092383000 |
| Saturday, January 1, 2022 | 9067000000 | 2441242000 |
| Sunday, January 1, 2023 | 9027000000 | 4071687000 |
| Monday, January 1, 2024 | 5028229000 |
Unveiling the hidden dimensions of data
In the ever-evolving landscape of industrial giants, Parker-Hannifin Corporation and Canadian National Railway Company stand as titans in their respective fields. Over the past decade, from 2014 to 2023, these companies have showcased intriguing trends in their EBITDA, a key indicator of financial health.
Canadian National Railway has consistently demonstrated robust growth, with its EBITDA increasing by approximately 59% from 2014 to 2023. This growth underscores its strategic prowess in the North American transportation sector. In contrast, Parker-Hannifin Corporation, a leader in motion and control technologies, has shown a remarkable 122% increase in EBITDA over the same period, highlighting its adaptability and innovation in a competitive market.
While Canadian National Railway's EBITDA peaked in 2022, Parker-Hannifin reached new heights in 2023, despite missing data for 2024. This analysis offers a glimpse into the dynamic financial trajectories of these industrial powerhouses.
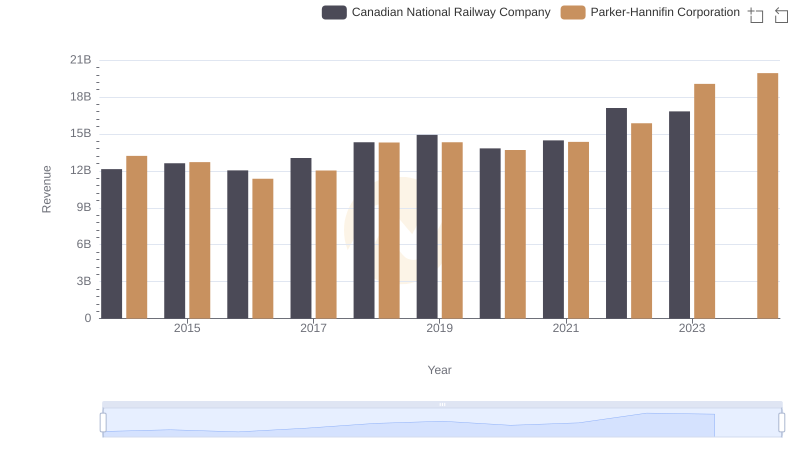
Who Generates More Revenue? Parker-Hannifin Corporation or Canadian National Railway Company
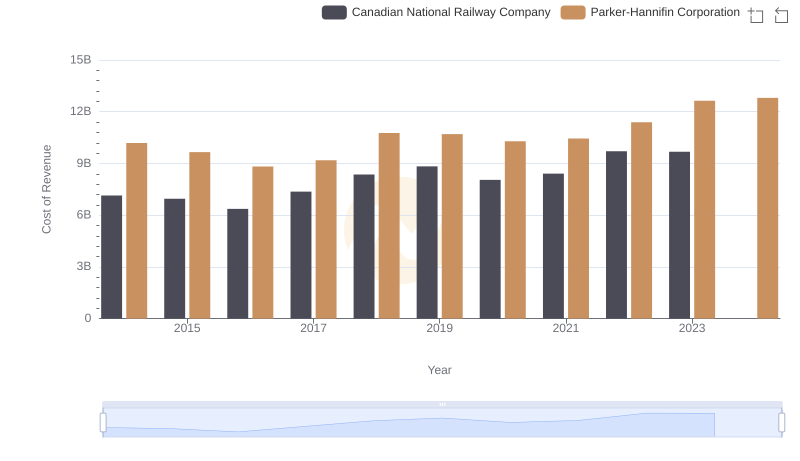
Cost of Revenue Trends: Parker-Hannifin Corporation vs Canadian National Railway Company
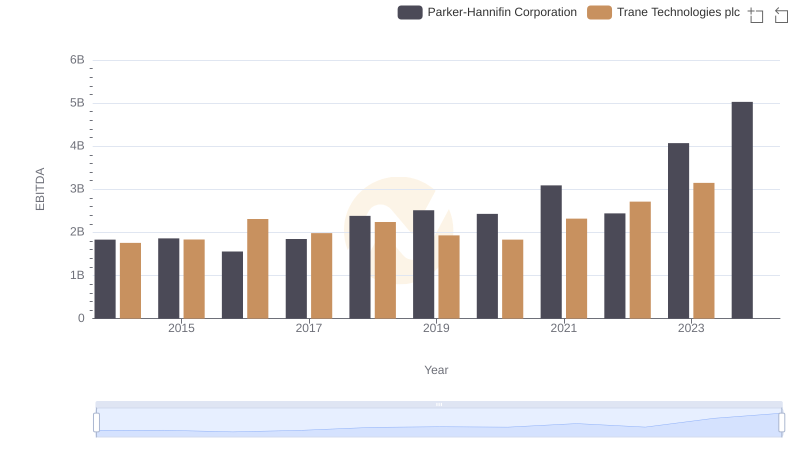
EBITDA Analysis: Evaluating Parker-Hannifin Corporation Against Trane Technologies plc

EBITDA Metrics Evaluated: Parker-Hannifin Corporation vs Illinois Tool Works Inc.
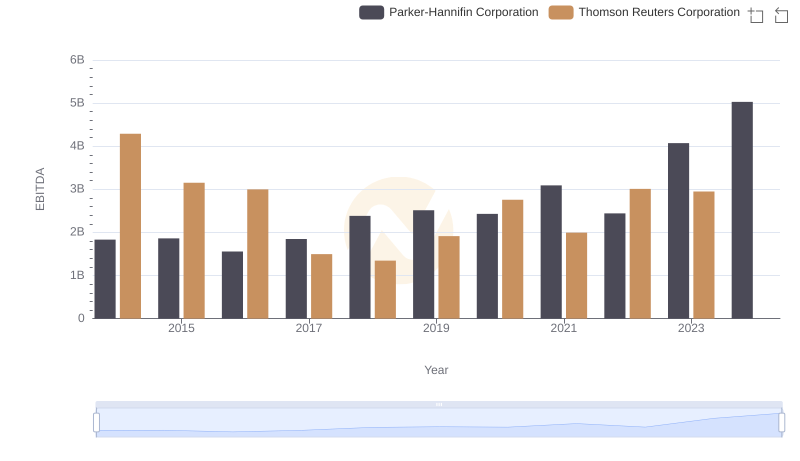
Parker-Hannifin Corporation vs Thomson Reuters Corporation: In-Depth EBITDA Performance Comparison
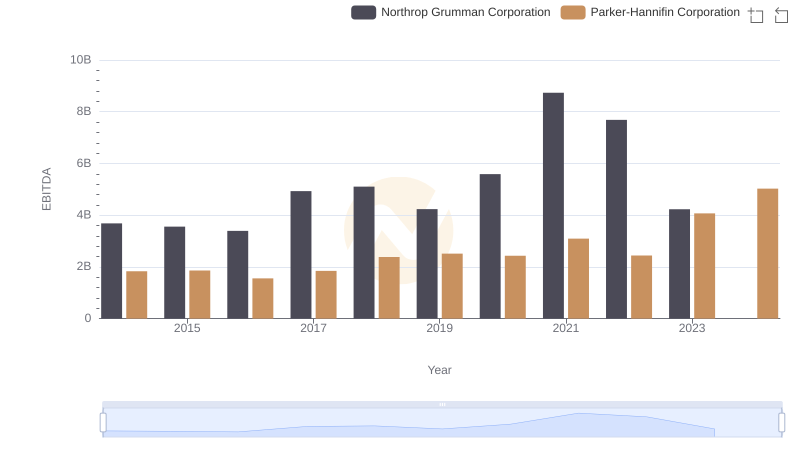
A Side-by-Side Analysis of EBITDA: Parker-Hannifin Corporation and Northrop Grumman Corporation

A Professional Review of EBITDA: Parker-Hannifin Corporation Compared to Norfolk Southern Corporation
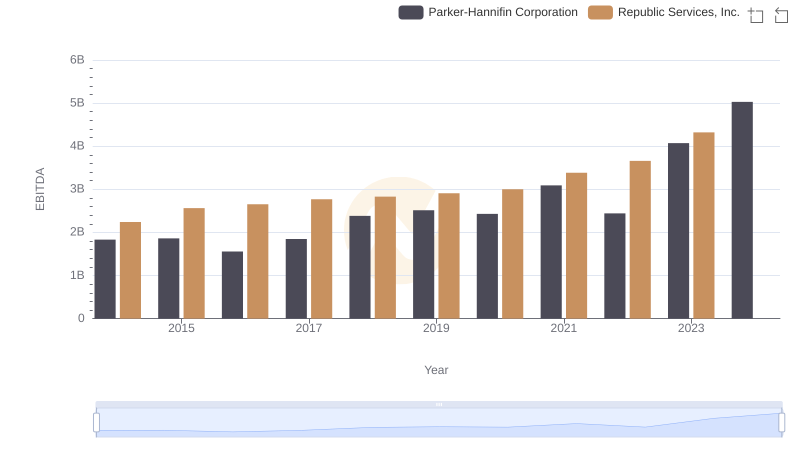
Comprehensive EBITDA Comparison: Parker-Hannifin Corporation vs Republic Services, Inc.
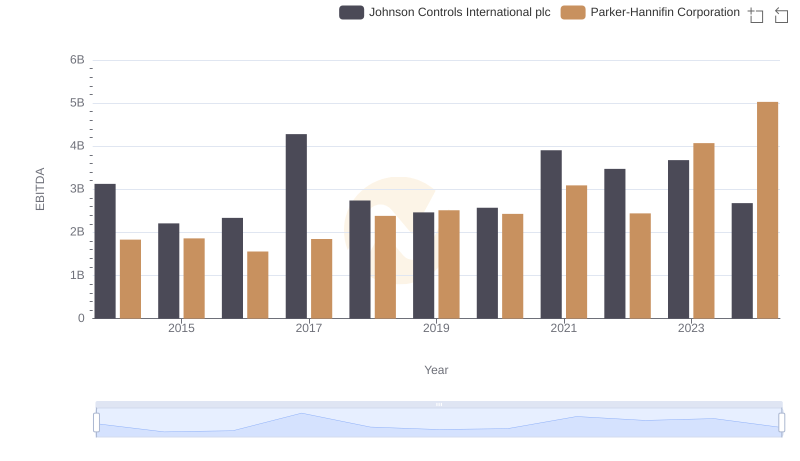
Professional EBITDA Benchmarking: Parker-Hannifin Corporation vs Johnson Controls International plc

EBITDA Metrics Evaluated: Parker-Hannifin Corporation vs Roper Technologies, Inc.