| __timestamp | Northrop Grumman Corporation | Parker-Hannifin Corporation |
|---|---|---|
| Wednesday, January 1, 2014 | 3681000000 | 1832903000 |
| Thursday, January 1, 2015 | 3558000000 | 1861551000 |
| Friday, January 1, 2016 | 3394000000 | 1558088000 |
| Sunday, January 1, 2017 | 4928000000 | 1846306000 |
| Monday, January 1, 2018 | 5104000000 | 2382235000 |
| Tuesday, January 1, 2019 | 4234000000 | 2513468000 |
| Wednesday, January 1, 2020 | 5588000000 | 2431500000 |
| Friday, January 1, 2021 | 8734000000 | 3092383000 |
| Saturday, January 1, 2022 | 7684000000 | 2441242000 |
| Sunday, January 1, 2023 | 4229000000 | 4071687000 |
| Monday, January 1, 2024 | 4370000000 | 5028229000 |
Cracking the code
In the ever-evolving landscape of industrial giants, Parker-Hannifin Corporation and Northrop Grumman Corporation have showcased intriguing financial trajectories over the past decade. From 2014 to 2023, Northrop Grumman's EBITDA surged by approximately 137%, peaking in 2021, while Parker-Hannifin's EBITDA grew by around 122%, reaching its zenith in 2023. This period highlights Northrop Grumman's dominance, with its EBITDA consistently surpassing Parker-Hannifin's, except in 2023 when Parker-Hannifin took the lead. The data reveals a compelling narrative of resilience and growth, with both companies navigating economic challenges and opportunities. Notably, the absence of Northrop Grumman's 2024 data leaves room for speculation on its future performance. As these industry leaders continue to innovate, their financial health remains a testament to their strategic prowess and adaptability.
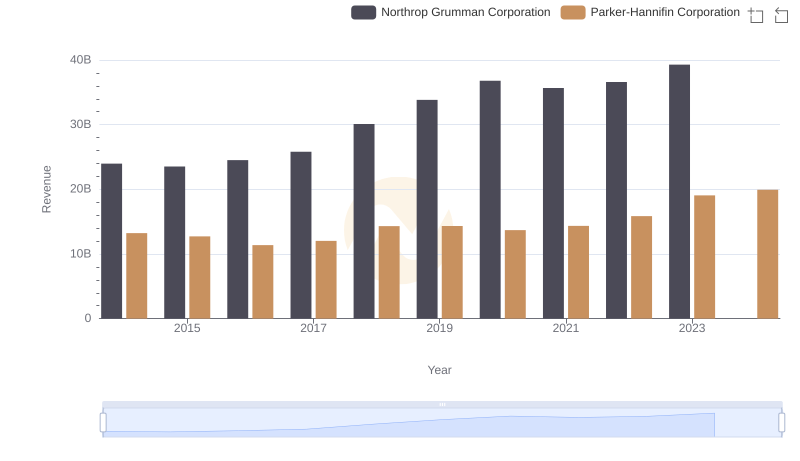
Revenue Insights: Parker-Hannifin Corporation and Northrop Grumman Corporation Performance Compared
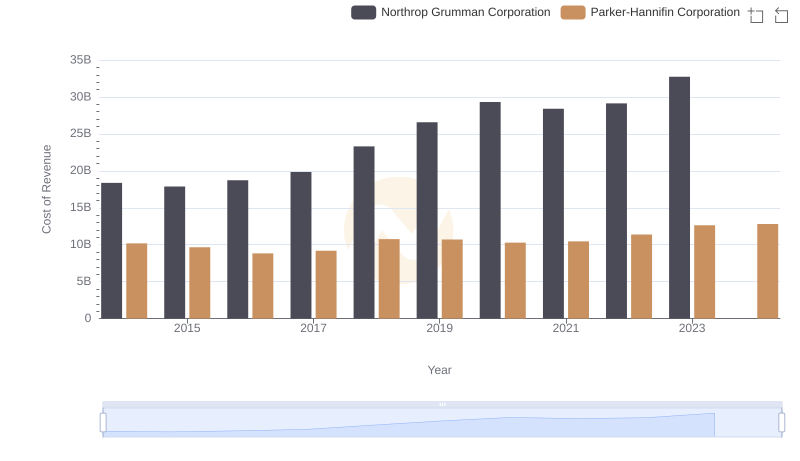
Cost Insights: Breaking Down Parker-Hannifin Corporation and Northrop Grumman Corporation's Expenses
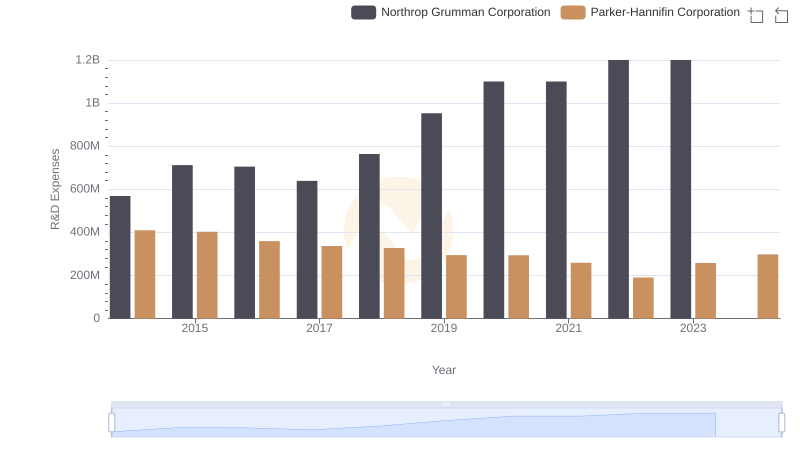
R&D Insights: How Parker-Hannifin Corporation and Northrop Grumman Corporation Allocate Funds
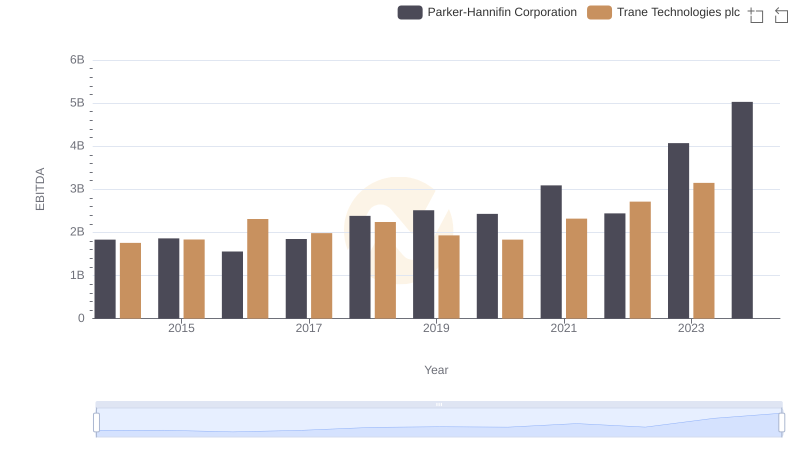
EBITDA Analysis: Evaluating Parker-Hannifin Corporation Against Trane Technologies plc

EBITDA Metrics Evaluated: Parker-Hannifin Corporation vs Illinois Tool Works Inc.
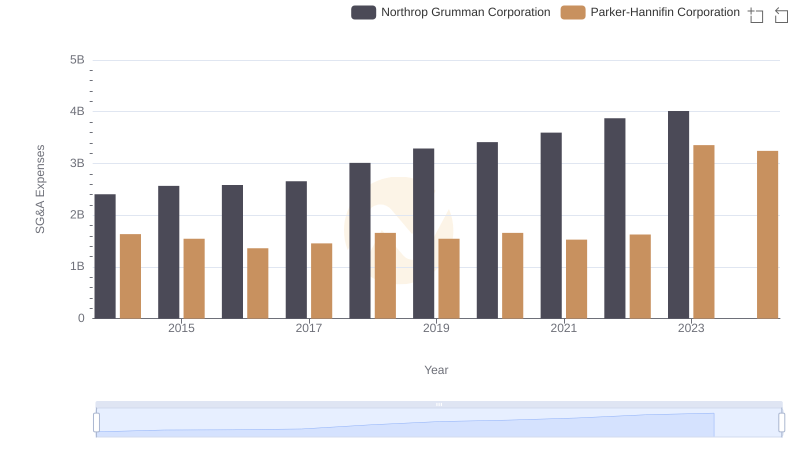
SG&A Efficiency Analysis: Comparing Parker-Hannifin Corporation and Northrop Grumman Corporation
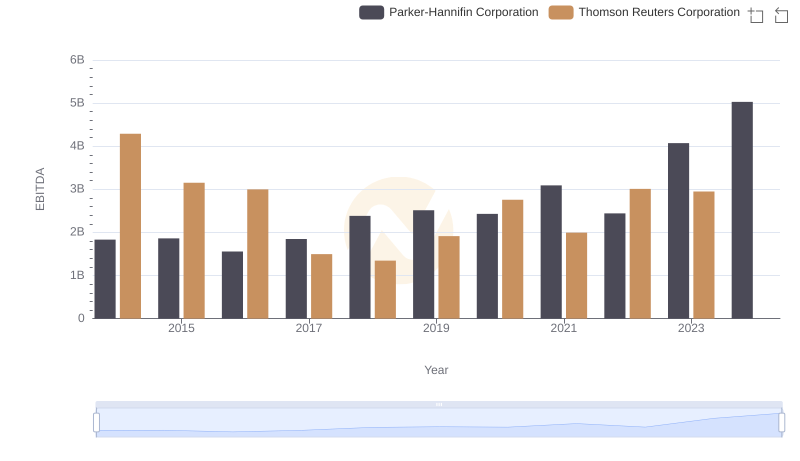
Parker-Hannifin Corporation vs Thomson Reuters Corporation: In-Depth EBITDA Performance Comparison
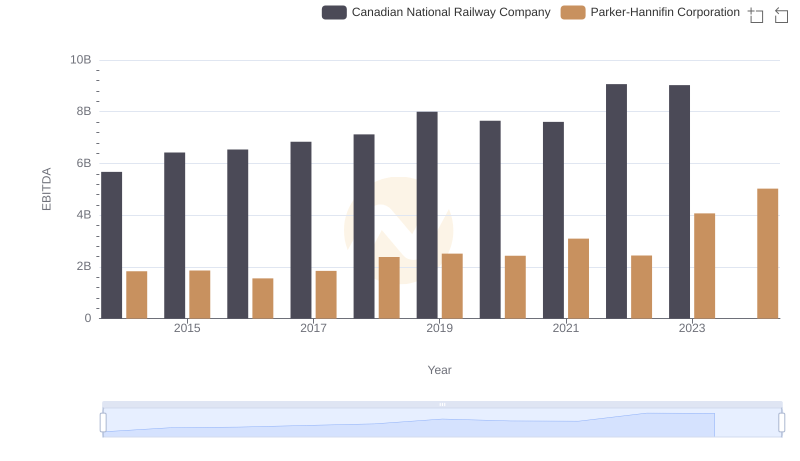
A Side-by-Side Analysis of EBITDA: Parker-Hannifin Corporation and Canadian National Railway Company

A Professional Review of EBITDA: Parker-Hannifin Corporation Compared to Norfolk Southern Corporation
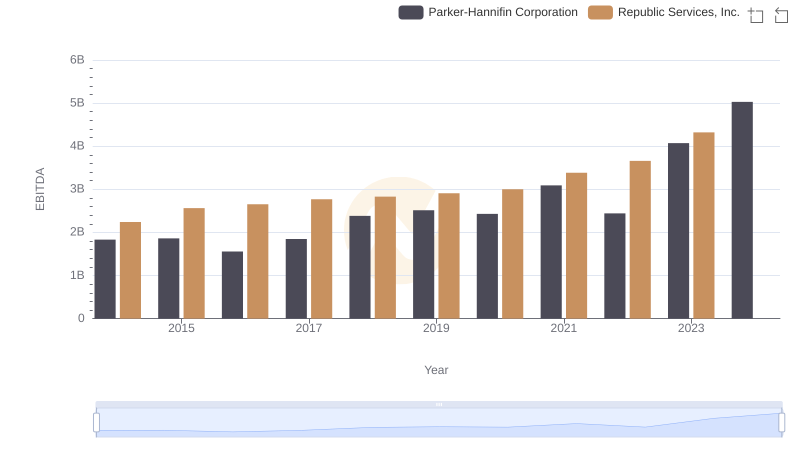
Comprehensive EBITDA Comparison: Parker-Hannifin Corporation vs Republic Services, Inc.