| __timestamp | Parker-Hannifin Corporation | Republic Services, Inc. |
|---|---|---|
| Wednesday, January 1, 2014 | 1832903000 | 2241300000 |
| Thursday, January 1, 2015 | 1861551000 | 2563300000 |
| Friday, January 1, 2016 | 1558088000 | 2653900000 |
| Sunday, January 1, 2017 | 1846306000 | 2769500000 |
| Monday, January 1, 2018 | 2382235000 | 2831400000 |
| Tuesday, January 1, 2019 | 2513468000 | 2909100000 |
| Wednesday, January 1, 2020 | 2431500000 | 3000100000 |
| Friday, January 1, 2021 | 3092383000 | 3384800000 |
| Saturday, January 1, 2022 | 2441242000 | 3659500000 |
| Sunday, January 1, 2023 | 4071687000 | 4320500000 |
| Monday, January 1, 2024 | 5028229000 | 4755000000 |
Unlocking the unknown
In the ever-evolving landscape of industrial and waste management sectors, Parker-Hannifin Corporation and Republic Services, Inc. have demonstrated remarkable EBITDA growth over the past decade. From 2014 to 2023, Parker-Hannifin's EBITDA surged by approximately 175%, peaking at $5.03 billion in 2023. Meanwhile, Republic Services experienced a steady climb, with a 93% increase, reaching $4.32 billion in the same year.
This data highlights the resilience and strategic prowess of these industry giants, despite economic fluctuations. Notably, 2024 data for Republic Services is missing, leaving room for speculation on future trends. As these companies continue to innovate, stakeholders and investors should keep a keen eye on their financial trajectories.
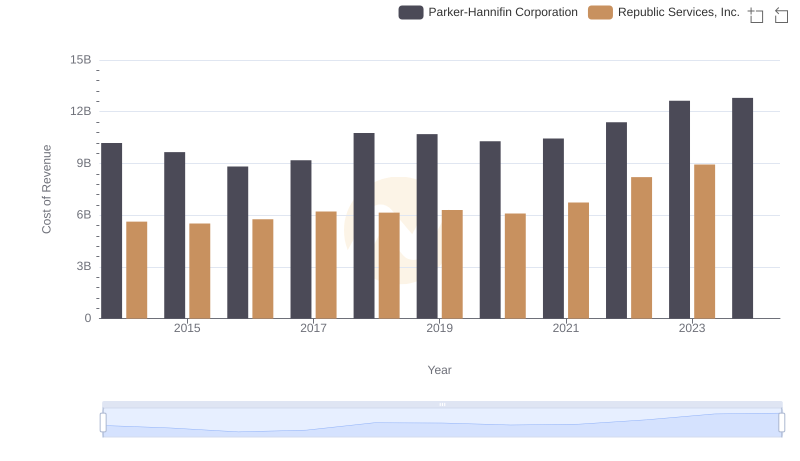
Cost of Revenue Comparison: Parker-Hannifin Corporation vs Republic Services, Inc.

Gross Profit Trends Compared: Parker-Hannifin Corporation vs Republic Services, Inc.
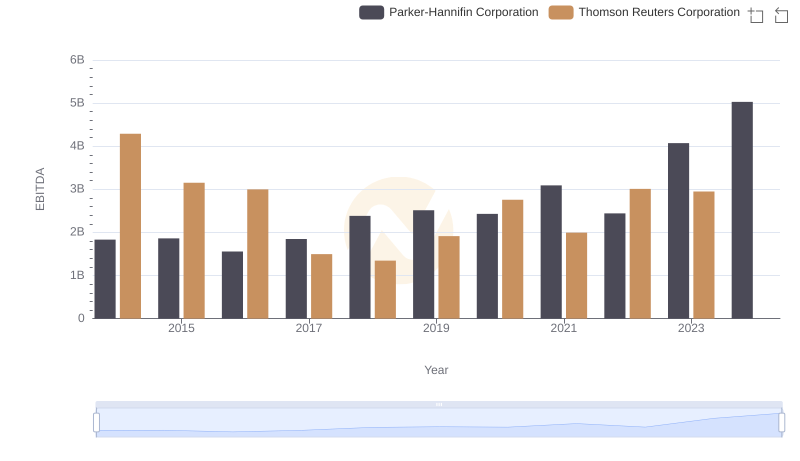
Parker-Hannifin Corporation vs Thomson Reuters Corporation: In-Depth EBITDA Performance Comparison
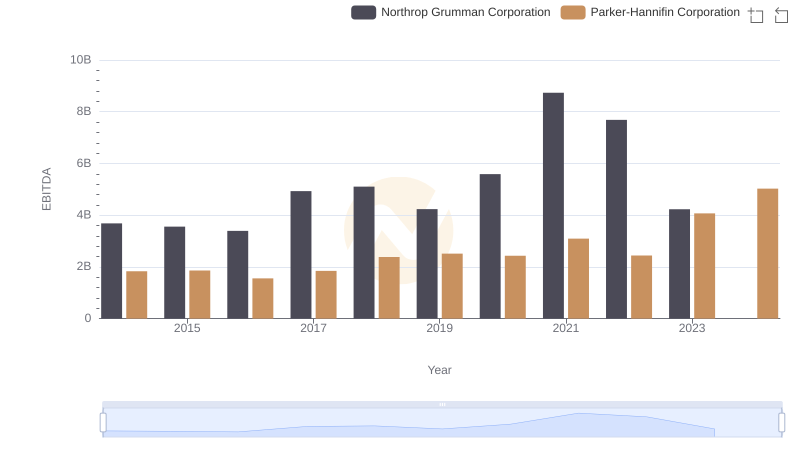
A Side-by-Side Analysis of EBITDA: Parker-Hannifin Corporation and Northrop Grumman Corporation
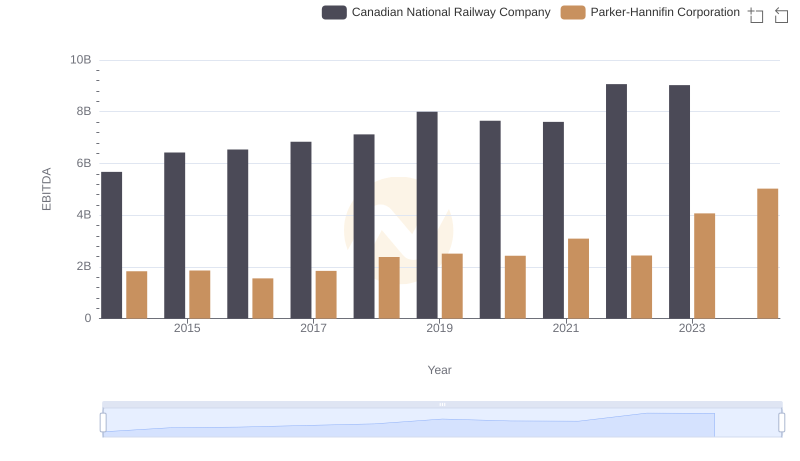
A Side-by-Side Analysis of EBITDA: Parker-Hannifin Corporation and Canadian National Railway Company

A Professional Review of EBITDA: Parker-Hannifin Corporation Compared to Norfolk Southern Corporation
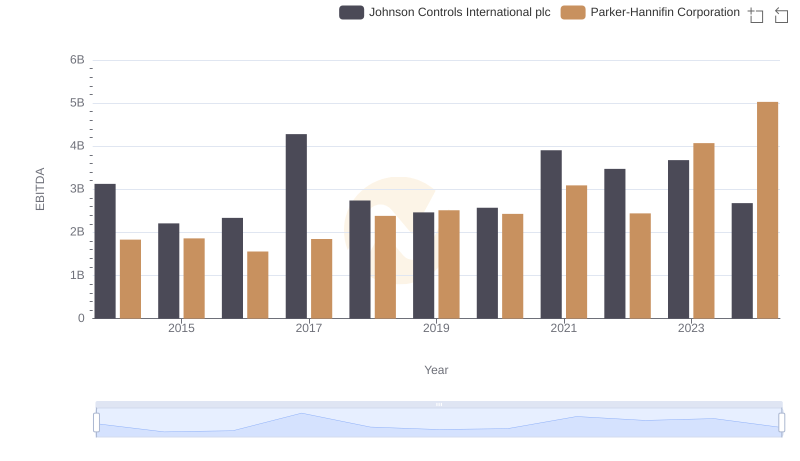
Professional EBITDA Benchmarking: Parker-Hannifin Corporation vs Johnson Controls International plc

EBITDA Metrics Evaluated: Parker-Hannifin Corporation vs Roper Technologies, Inc.
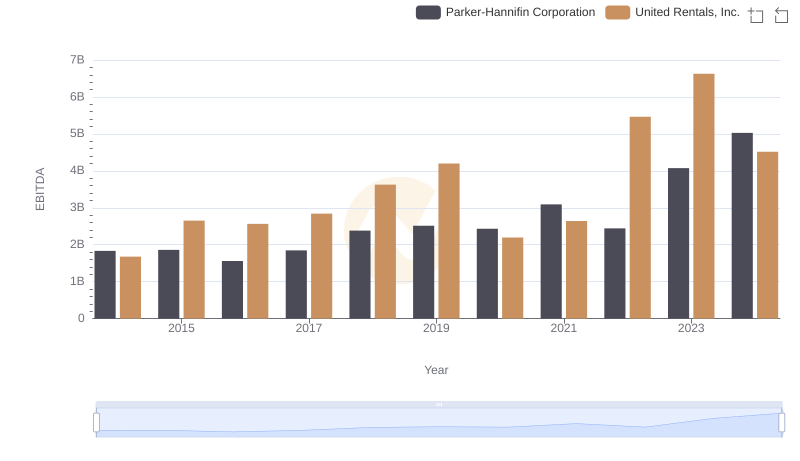
A Professional Review of EBITDA: Parker-Hannifin Corporation Compared to United Rentals, Inc.