| __timestamp | Parker-Hannifin Corporation | Roper Technologies, Inc. |
|---|---|---|
| Wednesday, January 1, 2014 | 1832903000 | 1199557000 |
| Thursday, January 1, 2015 | 1861551000 | 1238079000 |
| Friday, January 1, 2016 | 1558088000 | 1290510000 |
| Sunday, January 1, 2017 | 1846306000 | 1558802000 |
| Monday, January 1, 2018 | 2382235000 | 1746500000 |
| Tuesday, January 1, 2019 | 2513468000 | 2827900000 |
| Wednesday, January 1, 2020 | 2431500000 | 1782800000 |
| Friday, January 1, 2021 | 3092383000 | 1951500000 |
| Saturday, January 1, 2022 | 2441242000 | 2124500000 |
| Sunday, January 1, 2023 | 4071687000 | 2663000000 |
| Monday, January 1, 2024 | 5028229000 | 1996800000 |
Data in motion
In the ever-evolving landscape of industrial innovation, Parker-Hannifin Corporation and Roper Technologies, Inc. have emerged as formidable players. Over the past decade, Parker-Hannifin has demonstrated a robust growth trajectory, with its EBITDA surging by approximately 175% from 2014 to 2023. This growth underscores its strategic prowess in the industrial sector. Meanwhile, Roper Technologies, despite a more modest increase of around 122% in the same period, has consistently maintained a strong market presence.
The year 2023 marked a significant milestone for Parker-Hannifin, as it achieved an EBITDA of over $4 billion, a testament to its resilience and adaptability. In contrast, Roper Technologies faced a data gap in 2024, highlighting potential challenges or strategic shifts. This comparative analysis not only reflects the dynamic nature of these corporations but also offers insights into their future trajectories.

Breaking Down Revenue Trends: Parker-Hannifin Corporation vs Roper Technologies, Inc.
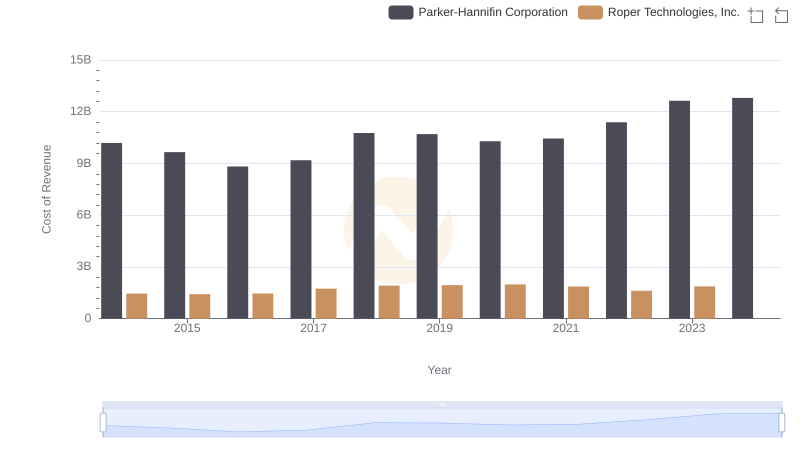
Cost Insights: Breaking Down Parker-Hannifin Corporation and Roper Technologies, Inc.'s Expenses

Parker-Hannifin Corporation vs Roper Technologies, Inc.: A Gross Profit Performance Breakdown
R&D Spending Showdown: Parker-Hannifin Corporation vs Roper Technologies, Inc.

A Professional Review of EBITDA: Parker-Hannifin Corporation Compared to Norfolk Southern Corporation
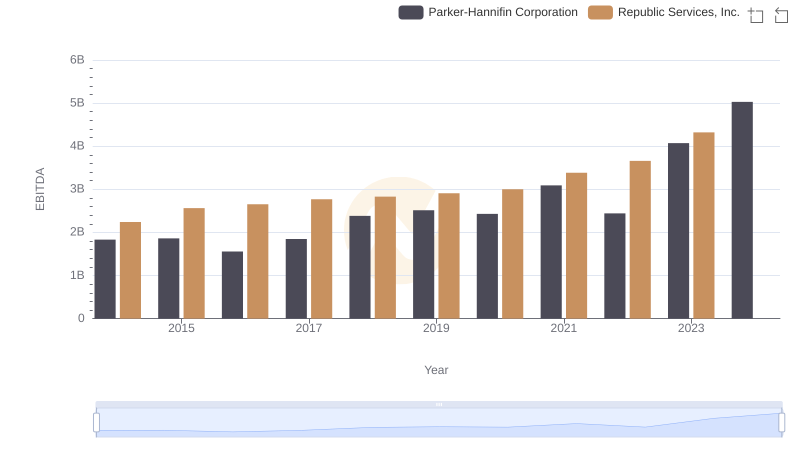
Comprehensive EBITDA Comparison: Parker-Hannifin Corporation vs Republic Services, Inc.

Parker-Hannifin Corporation and Roper Technologies, Inc.: SG&A Spending Patterns Compared
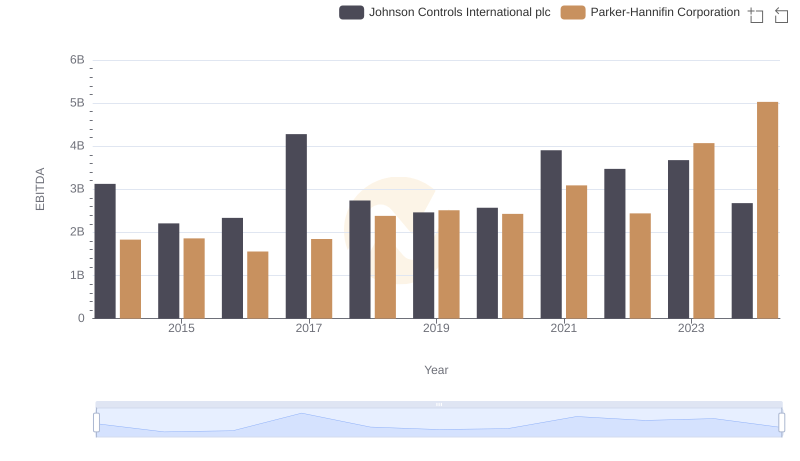
Professional EBITDA Benchmarking: Parker-Hannifin Corporation vs Johnson Controls International plc
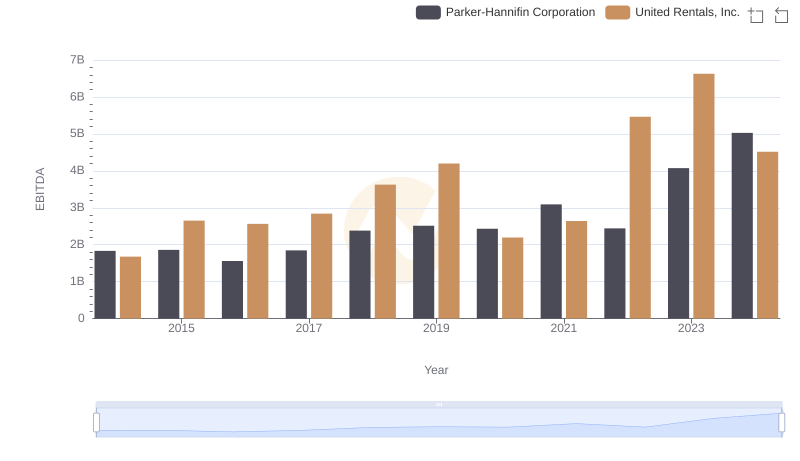
A Professional Review of EBITDA: Parker-Hannifin Corporation Compared to United Rentals, Inc.
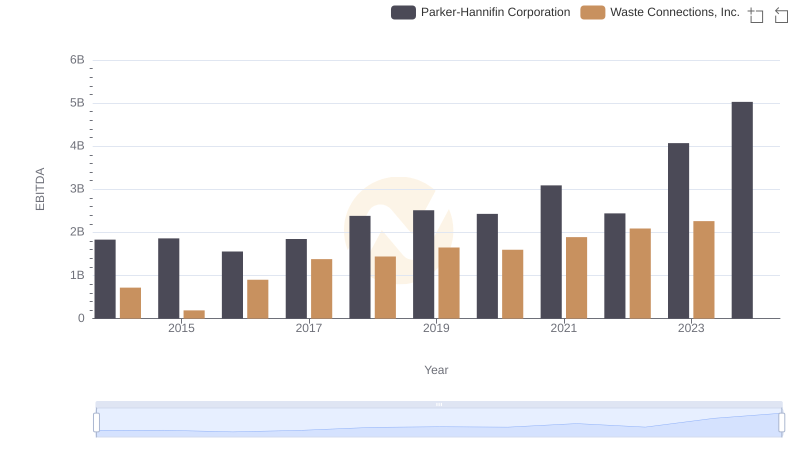
Professional EBITDA Benchmarking: Parker-Hannifin Corporation vs Waste Connections, Inc.