| __timestamp | Johnson Controls International plc | Parker-Hannifin Corporation |
|---|---|---|
| Wednesday, January 1, 2014 | 36201000000 | 10188227000 |
| Thursday, January 1, 2015 | 30732000000 | 9655245000 |
| Friday, January 1, 2016 | 15183000000 | 8823384000 |
| Sunday, January 1, 2017 | 20833000000 | 9188962000 |
| Monday, January 1, 2018 | 22020000000 | 10762841000 |
| Tuesday, January 1, 2019 | 16275000000 | 10703484000 |
| Wednesday, January 1, 2020 | 14906000000 | 10286518000 |
| Friday, January 1, 2021 | 15609000000 | 10449680000 |
| Saturday, January 1, 2022 | 16956000000 | 11387267000 |
| Sunday, January 1, 2023 | 17822000000 | 12635892000 |
| Monday, January 1, 2024 | 14875000000 | 12801816000 |
Igniting the spark of knowledge
In the ever-evolving landscape of industrial manufacturing, Parker-Hannifin Corporation and Johnson Controls International plc stand as titans. Over the past decade, these companies have showcased contrasting trajectories in their cost of revenue. From 2014 to 2024, Johnson Controls experienced a significant decline of approximately 59% in their cost of revenue, starting from a peak in 2014. Meanwhile, Parker-Hannifin demonstrated a steady growth of around 26% over the same period, reflecting their strategic focus on efficiency and innovation.
The data reveals a pivotal shift in 2016, where Johnson Controls' cost of revenue dropped sharply, while Parker-Hannifin began its upward trend. By 2023, Parker-Hannifin's cost of revenue had increased by nearly 24% compared to 2014, highlighting their resilience and adaptability in a competitive market. This comparison underscores the dynamic nature of the industrial sector and the strategic decisions that shape its future.
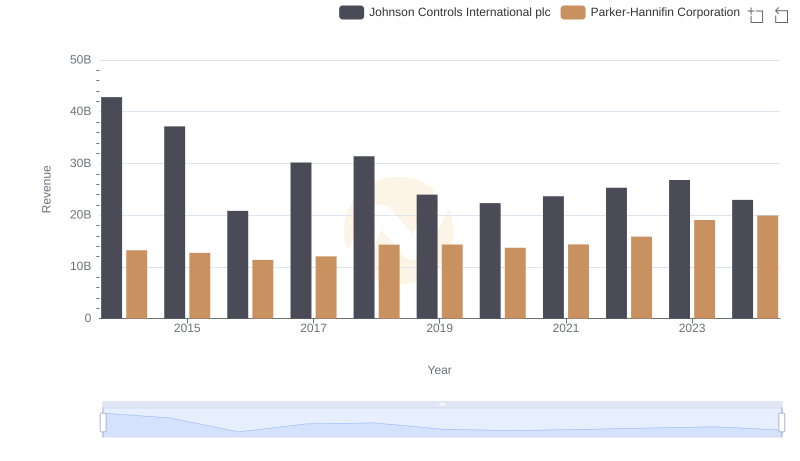
Who Generates More Revenue? Parker-Hannifin Corporation or Johnson Controls International plc
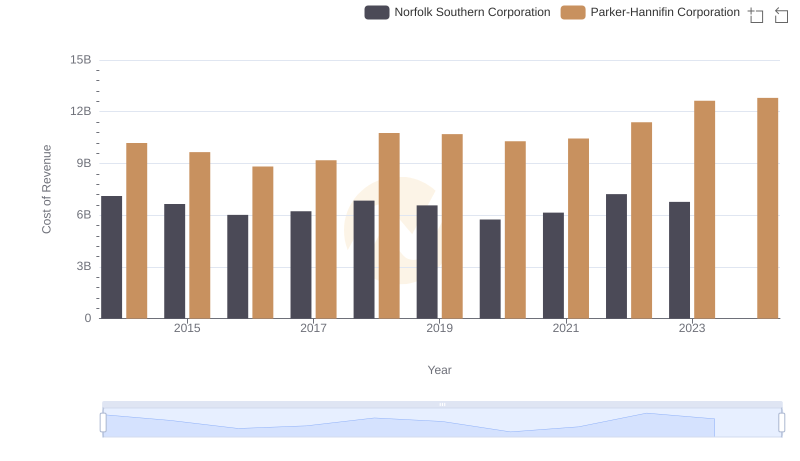
Analyzing Cost of Revenue: Parker-Hannifin Corporation and Norfolk Southern Corporation
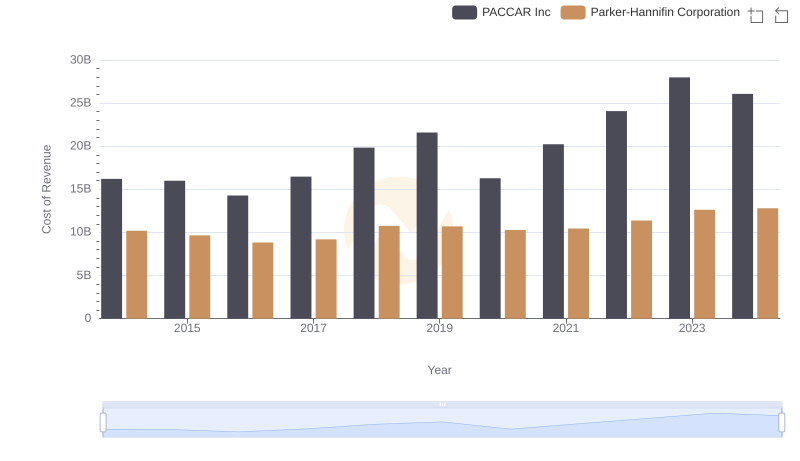
Comparing Cost of Revenue Efficiency: Parker-Hannifin Corporation vs PACCAR Inc
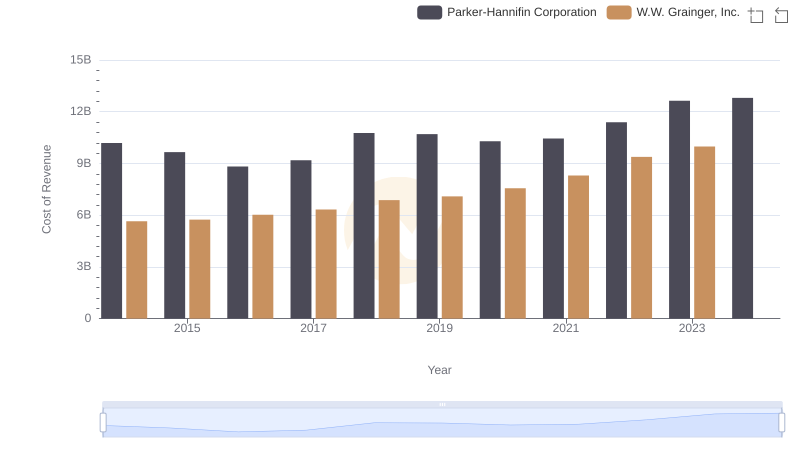
Comparing Cost of Revenue Efficiency: Parker-Hannifin Corporation vs W.W. Grainger, Inc.
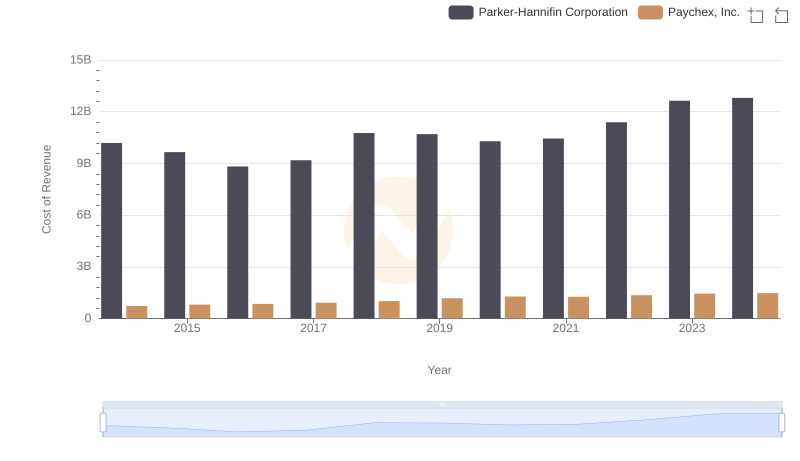
Comparing Cost of Revenue Efficiency: Parker-Hannifin Corporation vs Paychex, Inc.
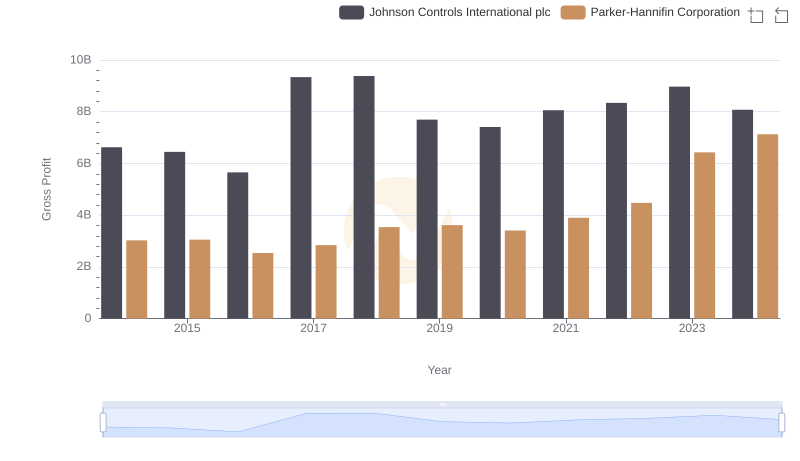
Gross Profit Comparison: Parker-Hannifin Corporation and Johnson Controls International plc Trends
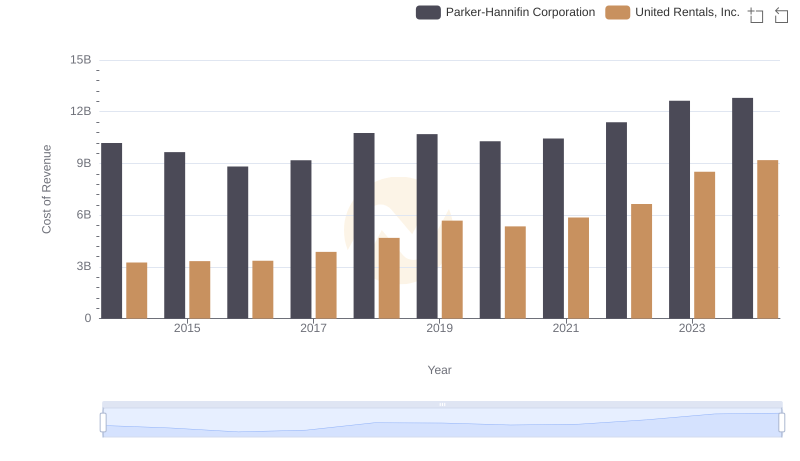
Analyzing Cost of Revenue: Parker-Hannifin Corporation and United Rentals, Inc.
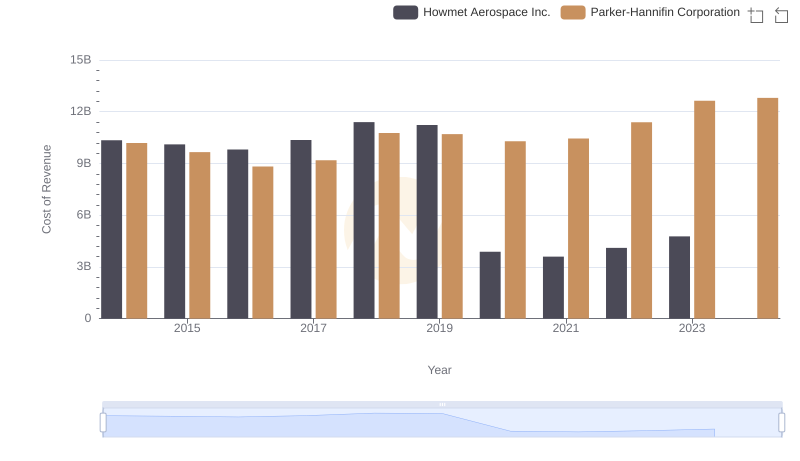
Analyzing Cost of Revenue: Parker-Hannifin Corporation and Howmet Aerospace Inc.
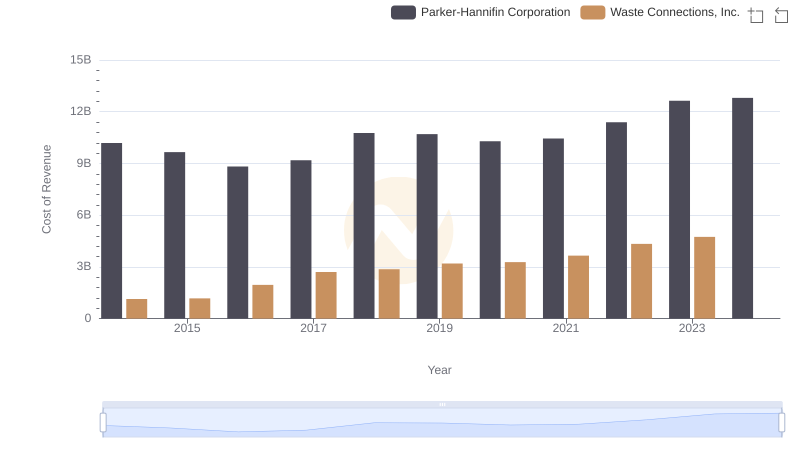
Cost Insights: Breaking Down Parker-Hannifin Corporation and Waste Connections, Inc.'s Expenses
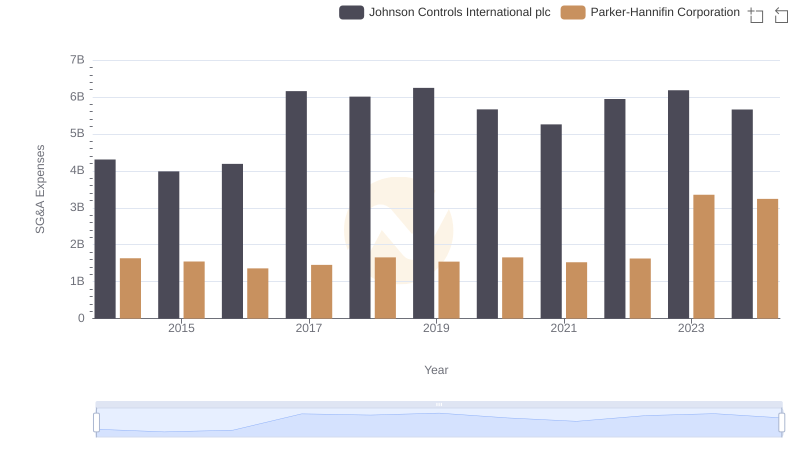
Parker-Hannifin Corporation or Johnson Controls International plc: Who Manages SG&A Costs Better?
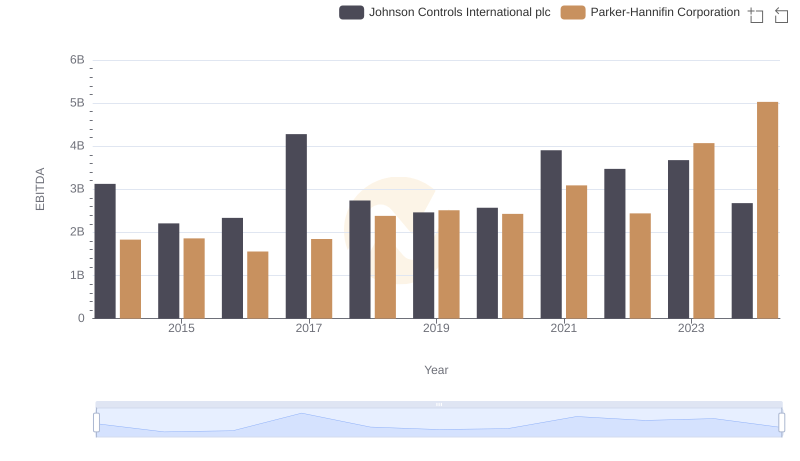
Professional EBITDA Benchmarking: Parker-Hannifin Corporation vs Johnson Controls International plc