| __timestamp | Parker-Hannifin Corporation | United Rentals, Inc. |
|---|---|---|
| Wednesday, January 1, 2014 | 1832903000 | 1678000000 |
| Thursday, January 1, 2015 | 1861551000 | 2653000000 |
| Friday, January 1, 2016 | 1558088000 | 2566000000 |
| Sunday, January 1, 2017 | 1846306000 | 2843000000 |
| Monday, January 1, 2018 | 2382235000 | 3628000000 |
| Tuesday, January 1, 2019 | 2513468000 | 4200000000 |
| Wednesday, January 1, 2020 | 2431500000 | 2195000000 |
| Friday, January 1, 2021 | 3092383000 | 2642000000 |
| Saturday, January 1, 2022 | 2441242000 | 5464000000 |
| Sunday, January 1, 2023 | 4071687000 | 6627000000 |
| Monday, January 1, 2024 | 5028229000 | 4516000000 |
Igniting the spark of knowledge
In the ever-evolving landscape of industrial giants, Parker-Hannifin Corporation and United Rentals, Inc. have showcased remarkable financial trajectories over the past decade. From 2014 to 2024, these companies have demonstrated resilience and growth, with EBITDA figures reflecting their strategic prowess.
Parker-Hannifin, a leader in motion and control technologies, saw its EBITDA grow by approximately 175% from 2014 to 2024. Notably, the year 2023 marked a significant leap, with a 67% increase from the previous year, reaching a peak of $5 billion in 2024.
United Rentals, the world's largest equipment rental company, experienced a robust 270% growth in EBITDA over the same period. The year 2022 was particularly outstanding, with a 107% surge, culminating in a record $6.6 billion in 2023.
These figures underscore the dynamic nature of the industrial sector, where strategic investments and market adaptability drive financial success.
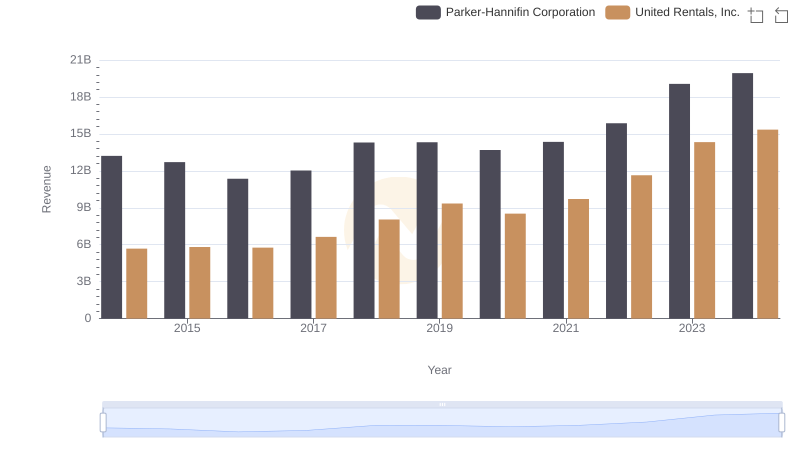
Parker-Hannifin Corporation vs United Rentals, Inc.: Examining Key Revenue Metrics
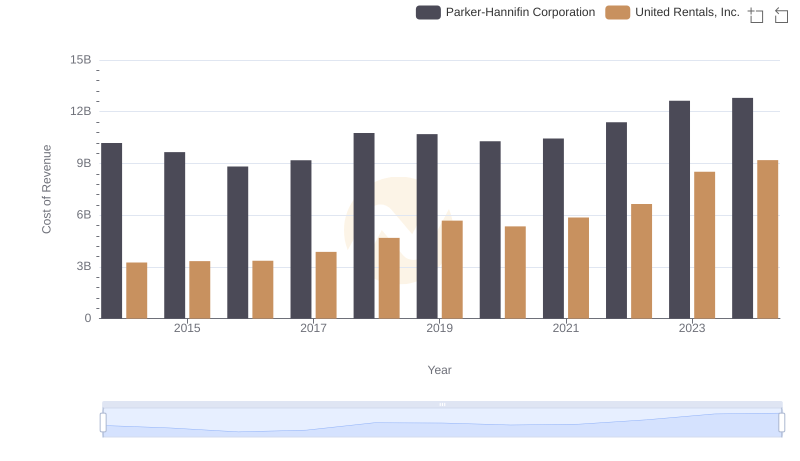
Analyzing Cost of Revenue: Parker-Hannifin Corporation and United Rentals, Inc.

A Professional Review of EBITDA: Parker-Hannifin Corporation Compared to Norfolk Southern Corporation
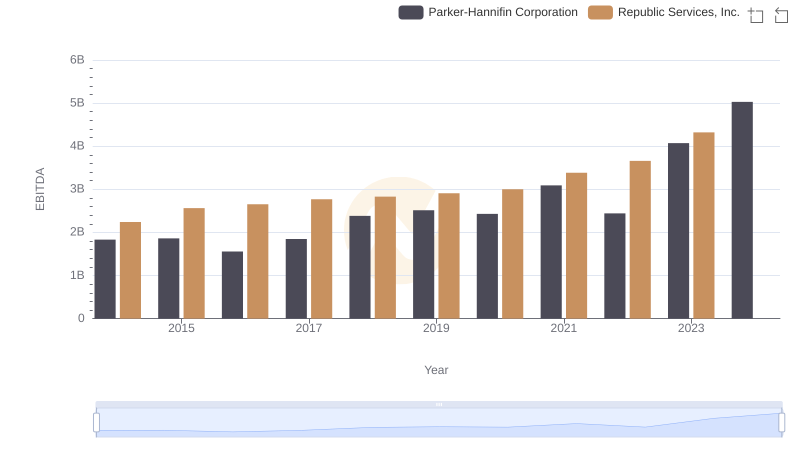
Comprehensive EBITDA Comparison: Parker-Hannifin Corporation vs Republic Services, Inc.
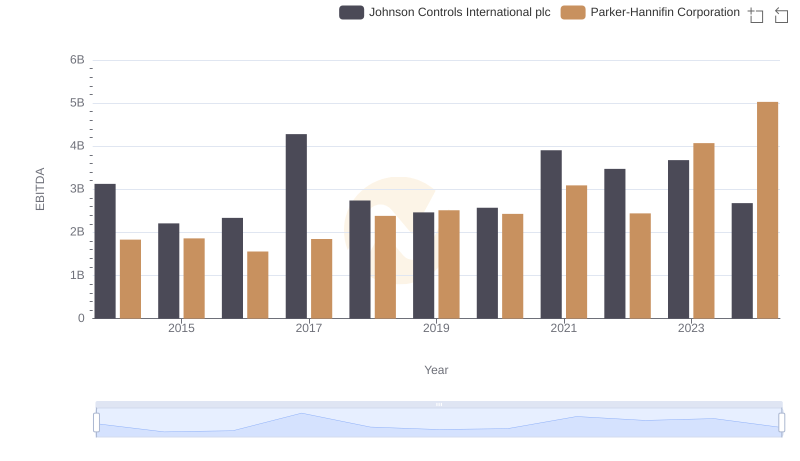
Professional EBITDA Benchmarking: Parker-Hannifin Corporation vs Johnson Controls International plc

EBITDA Metrics Evaluated: Parker-Hannifin Corporation vs Roper Technologies, Inc.
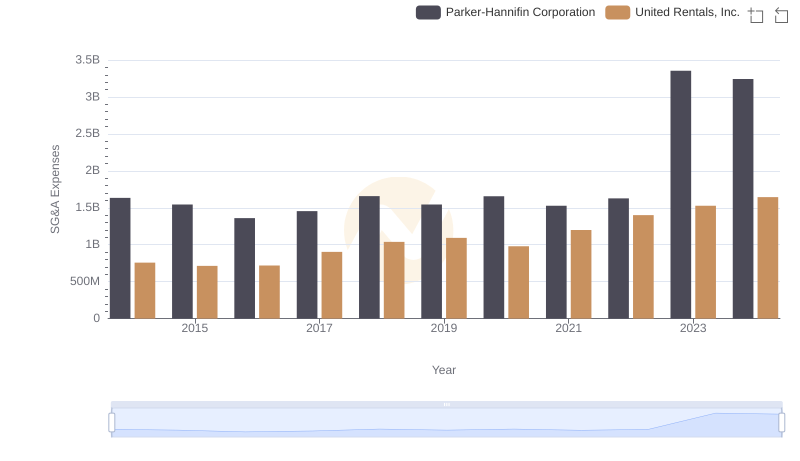
Who Optimizes SG&A Costs Better? Parker-Hannifin Corporation or United Rentals, Inc.
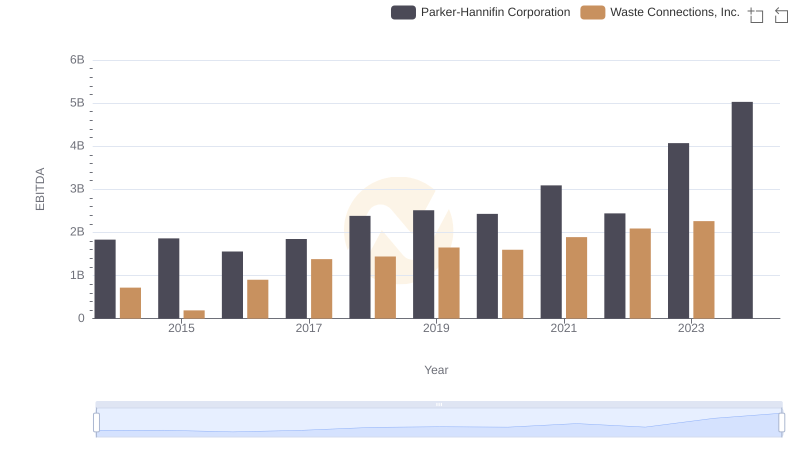
Professional EBITDA Benchmarking: Parker-Hannifin Corporation vs Waste Connections, Inc.
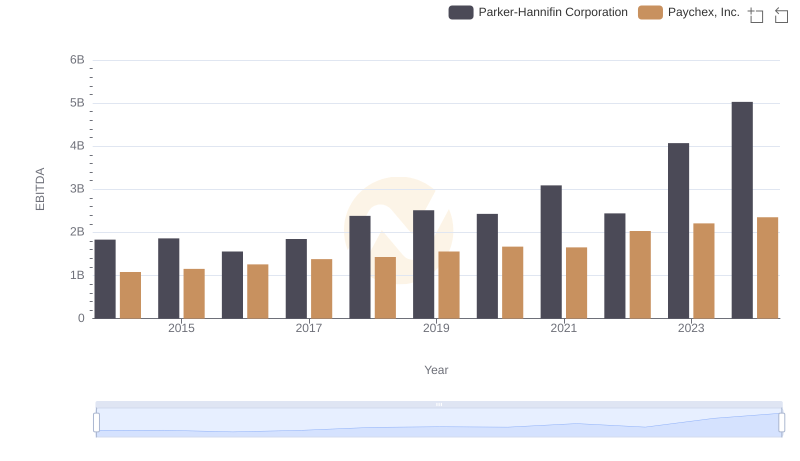
A Professional Review of EBITDA: Parker-Hannifin Corporation Compared to Paychex, Inc.