| __timestamp | Johnson Controls International plc | Parker-Hannifin Corporation |
|---|---|---|
| Wednesday, January 1, 2014 | 6627000000 | 3027744000 |
| Thursday, January 1, 2015 | 6447000000 | 3056499000 |
| Friday, January 1, 2016 | 5654000000 | 2537369000 |
| Sunday, January 1, 2017 | 9339000000 | 2840350000 |
| Monday, January 1, 2018 | 9380000000 | 3539551000 |
| Tuesday, January 1, 2019 | 7693000000 | 3616840000 |
| Wednesday, January 1, 2020 | 7411000000 | 3409002000 |
| Friday, January 1, 2021 | 8059000000 | 3897960000 |
| Saturday, January 1, 2022 | 8343000000 | 4474341000 |
| Sunday, January 1, 2023 | 8971000000 | 6429302000 |
| Monday, January 1, 2024 | 8077000000 | 7127790000 |
Igniting the spark of knowledge
In the ever-evolving landscape of industrial manufacturing, Parker-Hannifin Corporation and Johnson Controls International plc have emerged as titans. Over the past decade, these companies have showcased remarkable resilience and growth. From 2014 to 2024, Parker-Hannifin's gross profit surged by approximately 135%, reflecting its strategic innovations and market adaptability. In contrast, Johnson Controls experienced a more modest growth of around 22%, highlighting its steady yet consistent performance.
This comparison underscores the dynamic strategies employed by these industry leaders, offering valuable insights into their financial trajectories.

Parker-Hannifin Corporation vs CSX Corporation: A Gross Profit Performance Breakdown
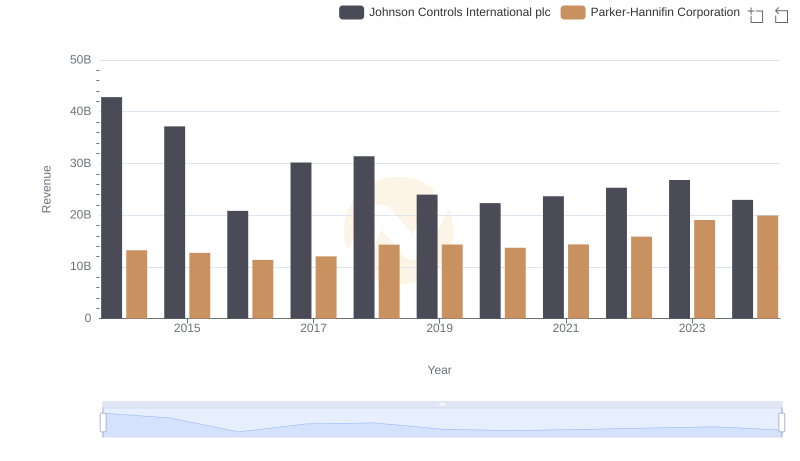
Who Generates More Revenue? Parker-Hannifin Corporation or Johnson Controls International plc

Parker-Hannifin Corporation vs Roper Technologies, Inc.: A Gross Profit Performance Breakdown
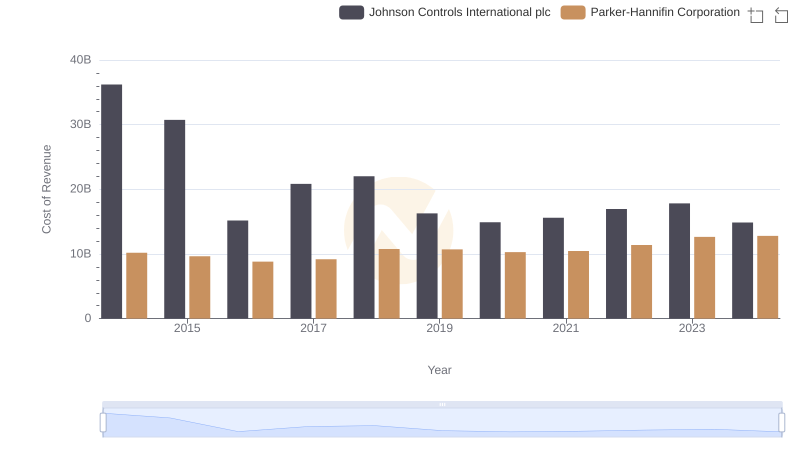
Cost of Revenue Comparison: Parker-Hannifin Corporation vs Johnson Controls International plc
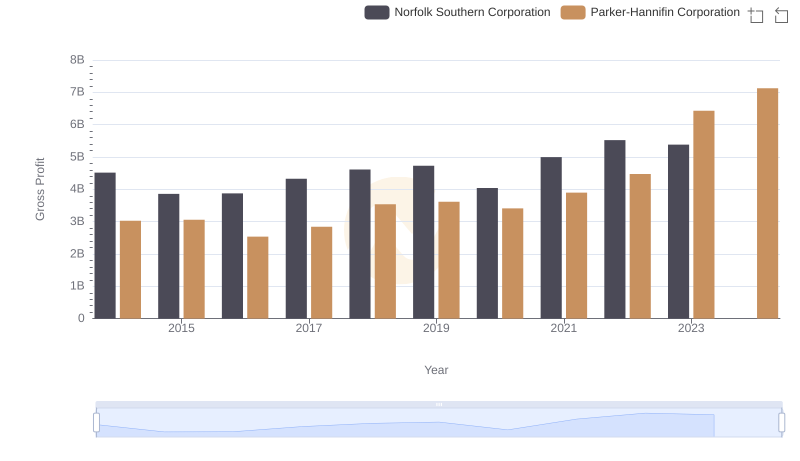
Who Generates Higher Gross Profit? Parker-Hannifin Corporation or Norfolk Southern Corporation
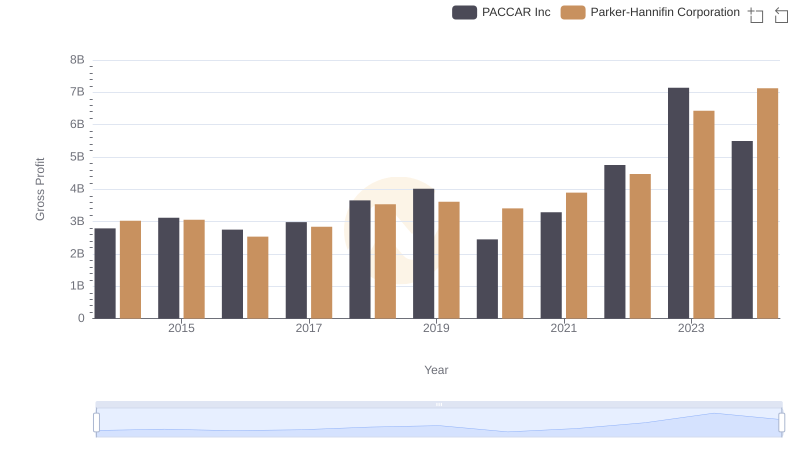
Key Insights on Gross Profit: Parker-Hannifin Corporation vs PACCAR Inc
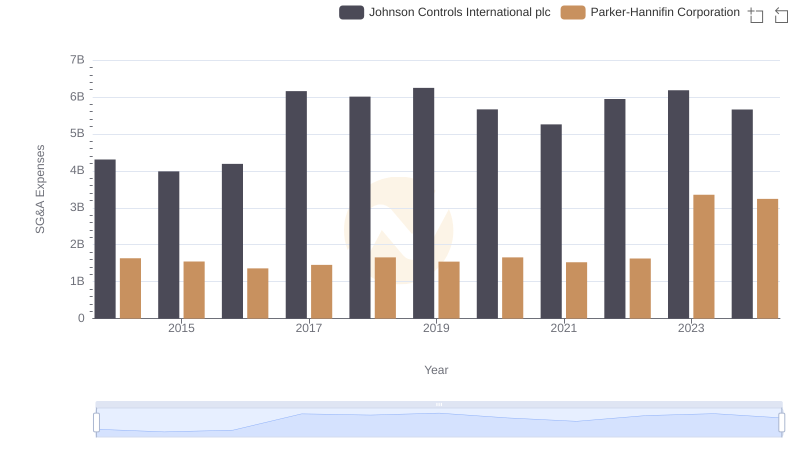
Parker-Hannifin Corporation or Johnson Controls International plc: Who Manages SG&A Costs Better?
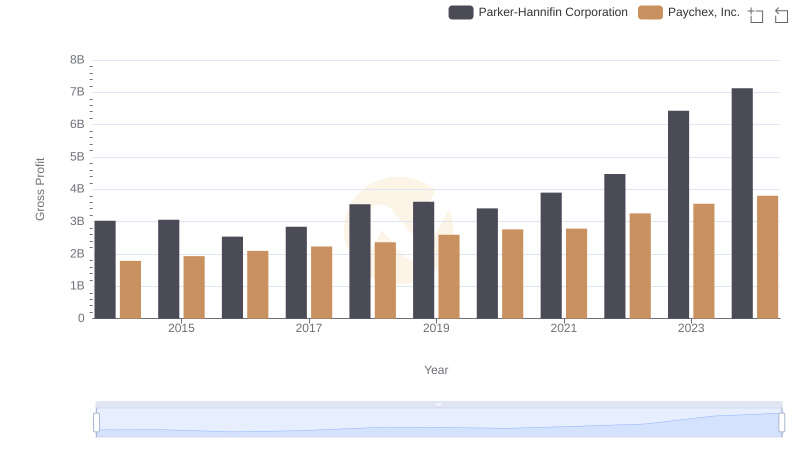
Who Generates Higher Gross Profit? Parker-Hannifin Corporation or Paychex, Inc.
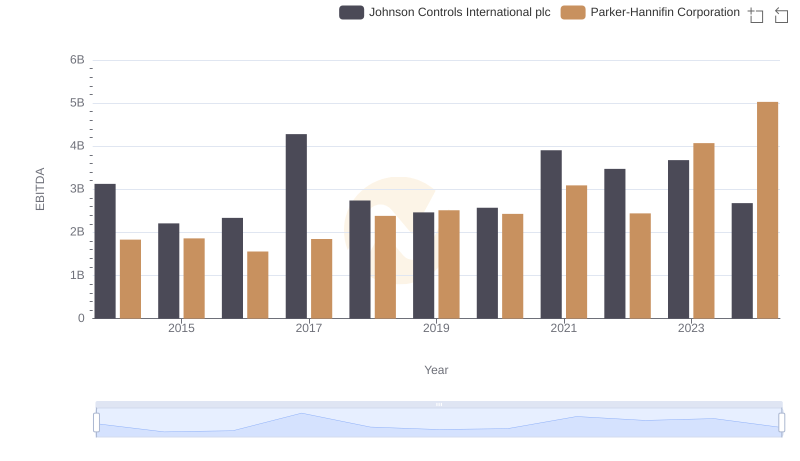
Professional EBITDA Benchmarking: Parker-Hannifin Corporation vs Johnson Controls International plc