| __timestamp | EMCOR Group, Inc. | TransUnion |
|---|---|---|
| Wednesday, January 1, 2014 | 355858000 | 429400000 |
| Thursday, January 1, 2015 | 362095000 | 478200000 |
| Friday, January 1, 2016 | 395913000 | 585300000 |
| Sunday, January 1, 2017 | 478459000 | 701100000 |
| Monday, January 1, 2018 | 489954000 | 819800000 |
| Tuesday, January 1, 2019 | 556055000 | 993200000 |
| Wednesday, January 1, 2020 | 601449000 | 883400000 |
| Friday, January 1, 2021 | 646861000 | 1010500000 |
| Saturday, January 1, 2022 | 682399000 | 1173800000 |
| Sunday, January 1, 2023 | 1009017000 | 667300000 |
| Monday, January 1, 2024 | 1204100000 |
Unleashing the power of data
In the ever-evolving landscape of corporate finance, EBITDA serves as a crucial indicator of a company's operational efficiency. Over the past decade, EMCOR Group, Inc. and TransUnion have showcased intriguing trends in their EBITDA performance. From 2014 to 2023, TransUnion consistently outperformed EMCOR, peaking in 2022 with an EBITDA approximately 72% higher than its 2014 figure. However, 2023 marked a dramatic shift, with EMCOR's EBITDA surging by 48% from the previous year, surpassing TransUnion for the first time in this period. This reversal highlights EMCOR's strategic adaptations in a post-pandemic economy. Meanwhile, TransUnion's 2023 EBITDA saw a notable decline, emphasizing the volatility and competitive nature of the financial services sector. As these giants continue to navigate economic challenges, their EBITDA trajectories offer valuable insights into their resilience and strategic foresight.
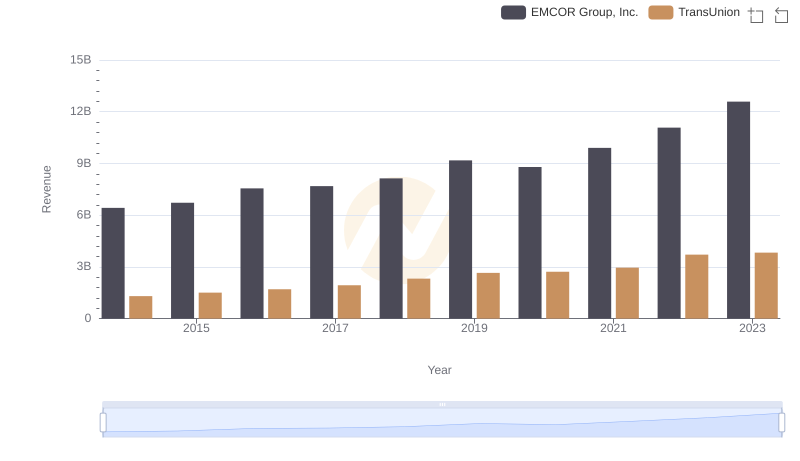
Revenue Insights: EMCOR Group, Inc. and TransUnion Performance Compared
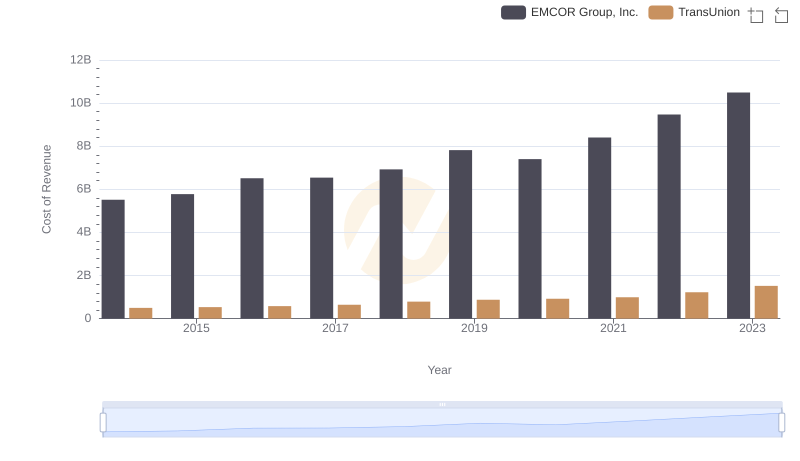
Cost of Revenue Trends: EMCOR Group, Inc. vs TransUnion
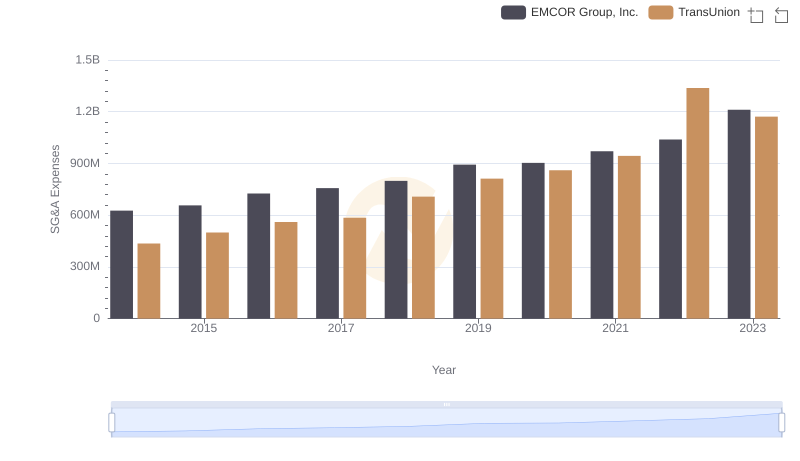
EMCOR Group, Inc. vs TransUnion: SG&A Expense Trends
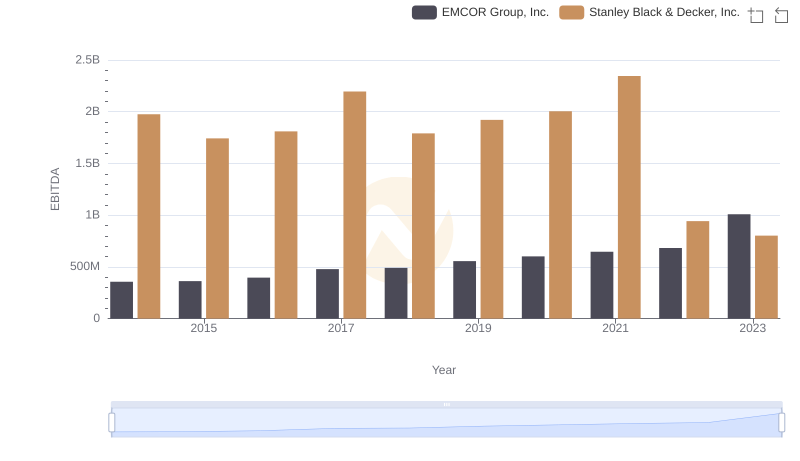
A Professional Review of EBITDA: EMCOR Group, Inc. Compared to Stanley Black & Decker, Inc.
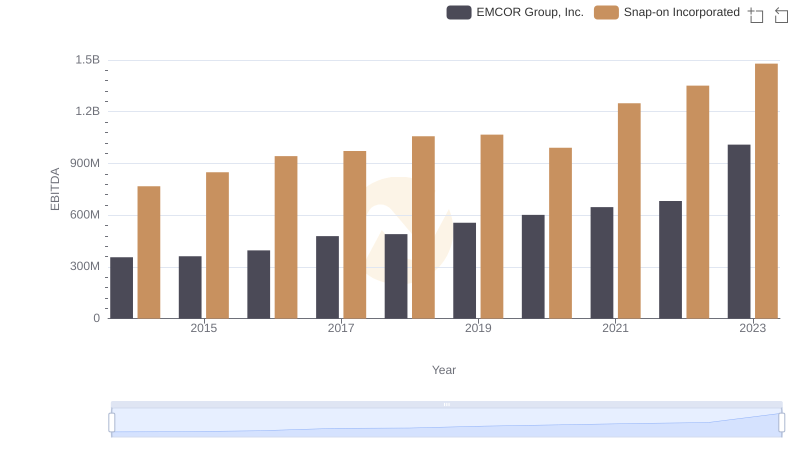
A Professional Review of EBITDA: EMCOR Group, Inc. Compared to Snap-on Incorporated
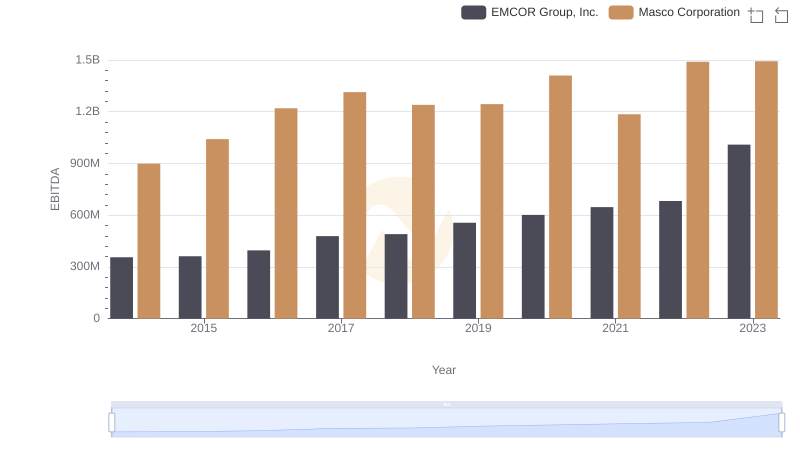
Professional EBITDA Benchmarking: EMCOR Group, Inc. vs Masco Corporation
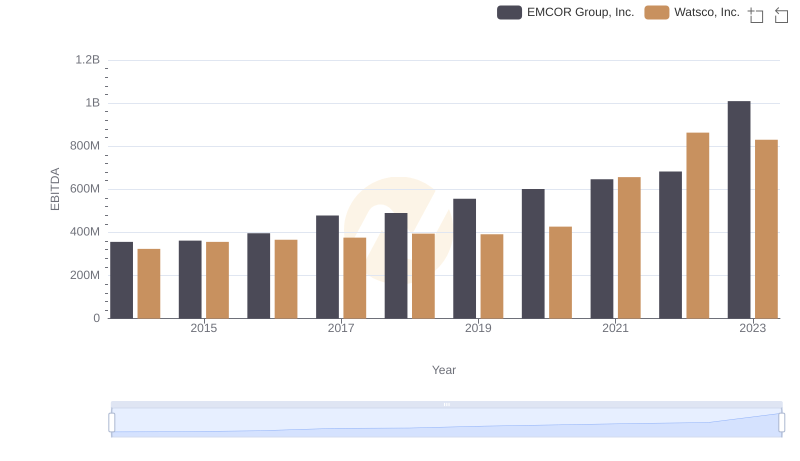
Comparative EBITDA Analysis: EMCOR Group, Inc. vs Watsco, Inc.
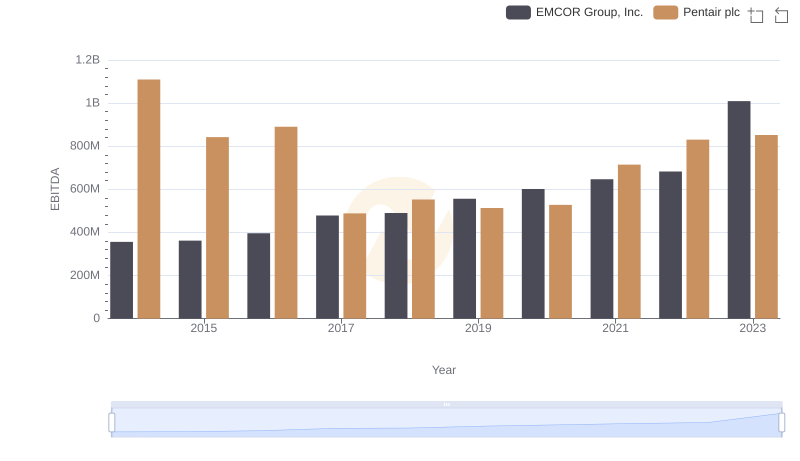
EBITDA Analysis: Evaluating EMCOR Group, Inc. Against Pentair plc
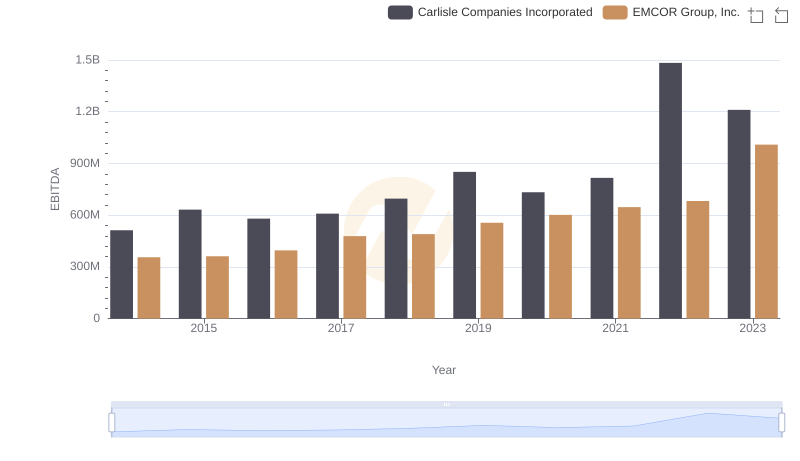
EMCOR Group, Inc. and Carlisle Companies Incorporated: A Detailed Examination of EBITDA Performance