| __timestamp | EMCOR Group, Inc. | Watsco, Inc. |
|---|---|---|
| Wednesday, January 1, 2014 | 355858000 | 323674000 |
| Thursday, January 1, 2015 | 362095000 | 355865000 |
| Friday, January 1, 2016 | 395913000 | 365698000 |
| Sunday, January 1, 2017 | 478459000 | 375907000 |
| Monday, January 1, 2018 | 489954000 | 394177000 |
| Tuesday, January 1, 2019 | 556055000 | 391396000 |
| Wednesday, January 1, 2020 | 601449000 | 426942000 |
| Friday, January 1, 2021 | 646861000 | 656655000 |
| Saturday, January 1, 2022 | 682399000 | 863261000 |
| Sunday, January 1, 2023 | 1009017000 | 829900000 |
| Monday, January 1, 2024 | 781775000 |
Infusing magic into the data realm
In the competitive landscape of the construction and HVAC industries, EMCOR Group, Inc. and Watsco, Inc. have demonstrated remarkable financial resilience over the past decade. From 2014 to 2023, EMCOR's EBITDA surged by approximately 184%, peaking in 2023, while Watsco's EBITDA grew by around 156% during the same period. This growth reflects strategic expansions and operational efficiencies that have propelled these companies to the forefront of their respective sectors.
This comparative analysis underscores the dynamic nature of these industry leaders, offering valuable insights for investors and stakeholders.
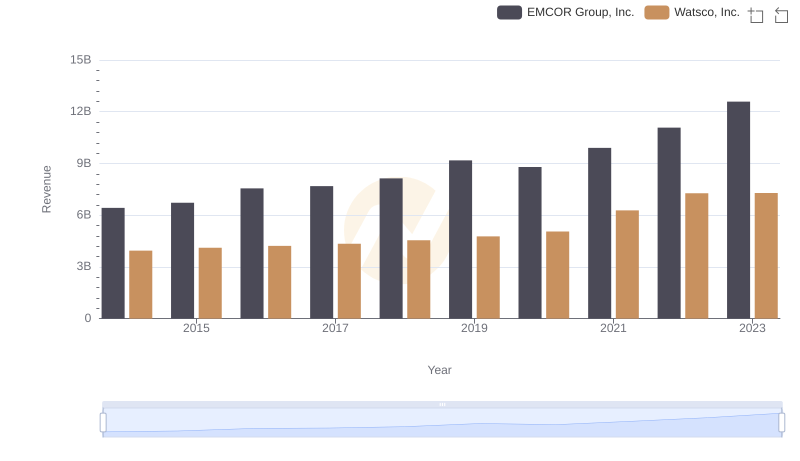
Revenue Showdown: EMCOR Group, Inc. vs Watsco, Inc.
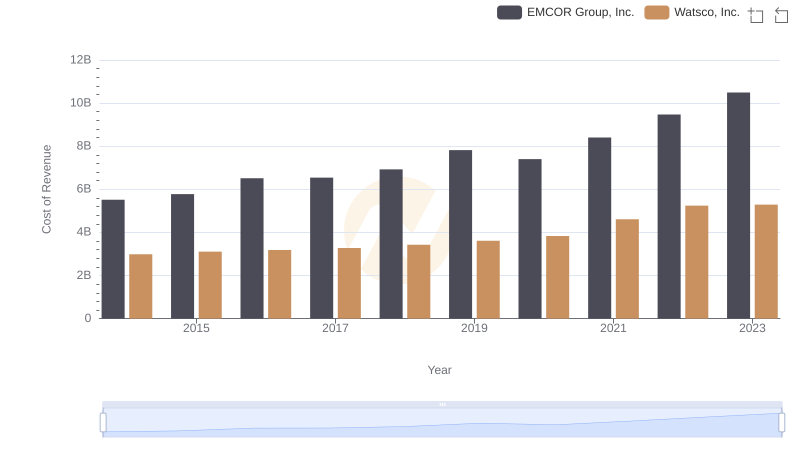
Cost Insights: Breaking Down EMCOR Group, Inc. and Watsco, Inc.'s Expenses
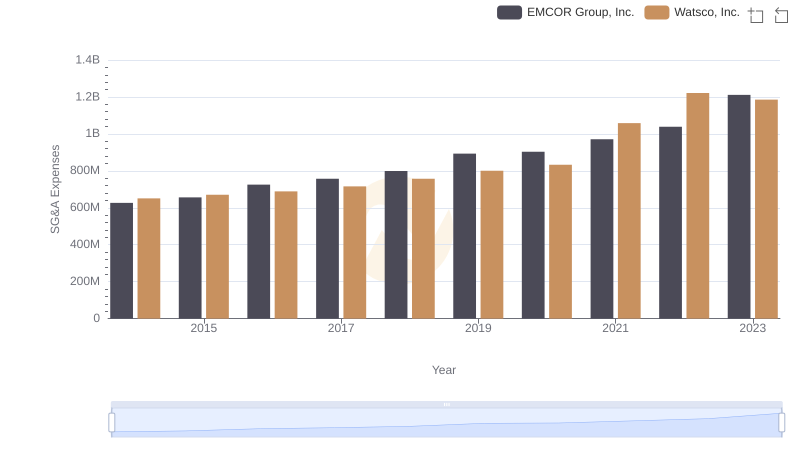
Cost Management Insights: SG&A Expenses for EMCOR Group, Inc. and Watsco, Inc.
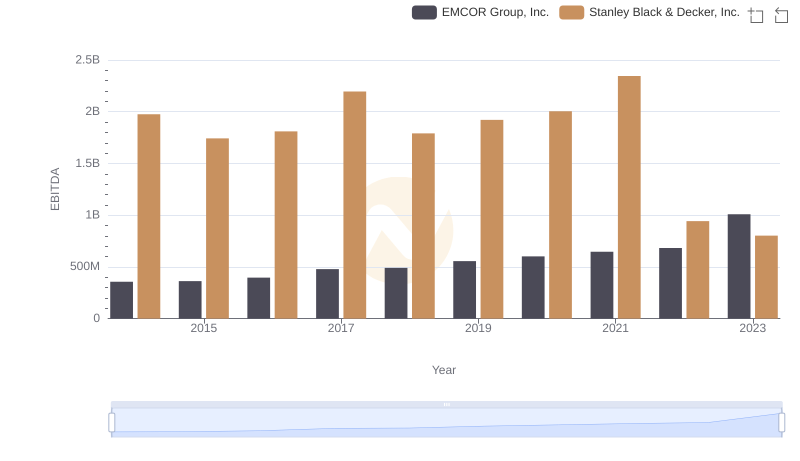
A Professional Review of EBITDA: EMCOR Group, Inc. Compared to Stanley Black & Decker, Inc.
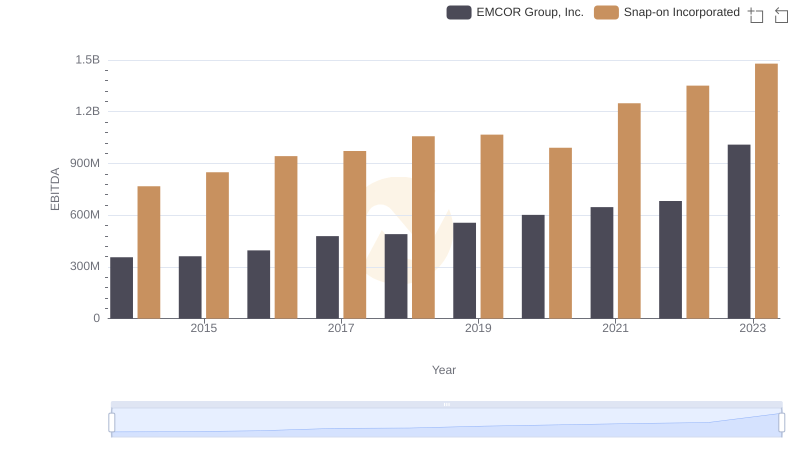
A Professional Review of EBITDA: EMCOR Group, Inc. Compared to Snap-on Incorporated
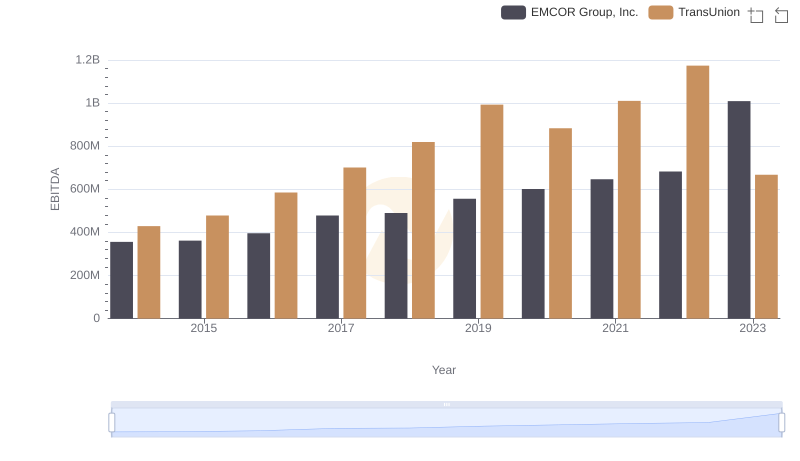
Comprehensive EBITDA Comparison: EMCOR Group, Inc. vs TransUnion
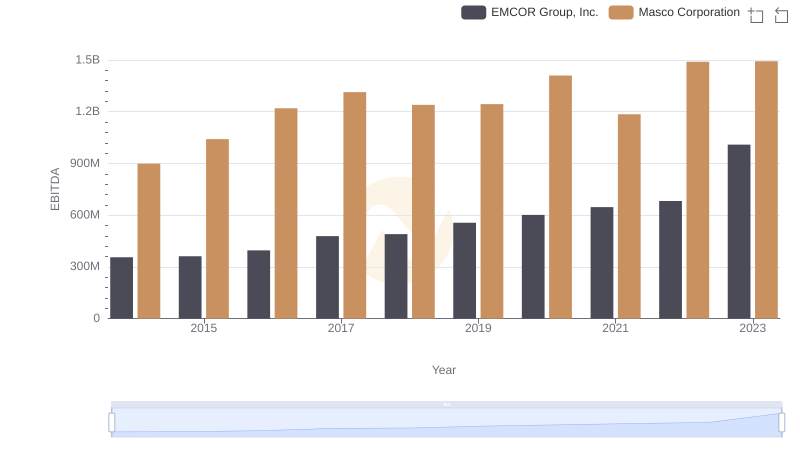
Professional EBITDA Benchmarking: EMCOR Group, Inc. vs Masco Corporation
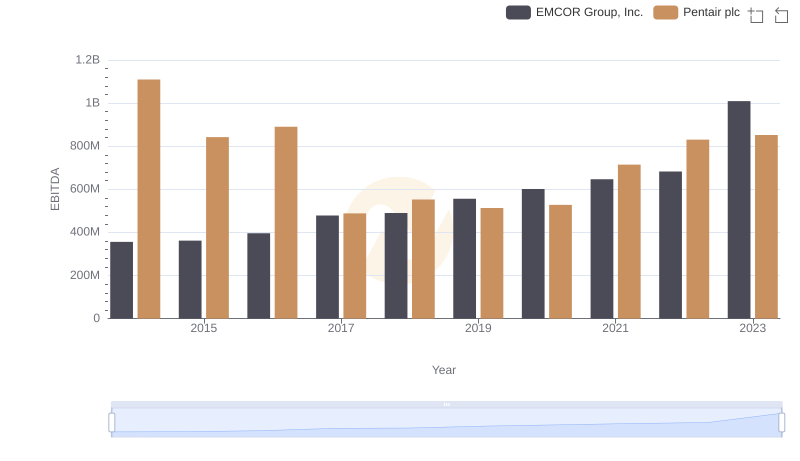
EBITDA Analysis: Evaluating EMCOR Group, Inc. Against Pentair plc
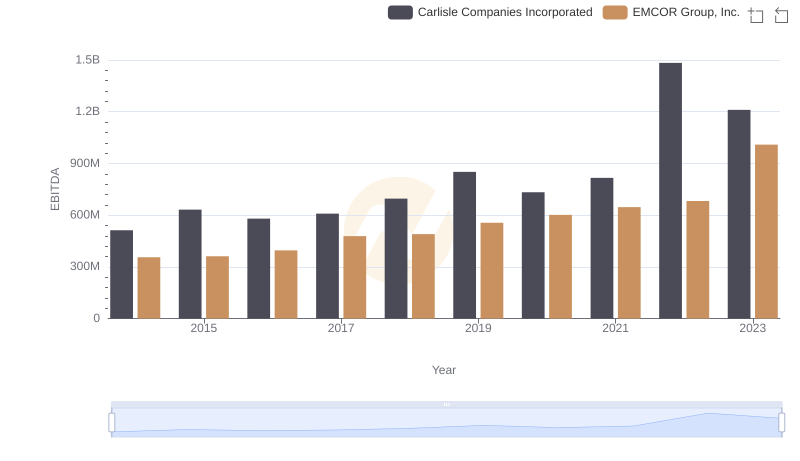
EMCOR Group, Inc. and Carlisle Companies Incorporated: A Detailed Examination of EBITDA Performance