| __timestamp | EMCOR Group, Inc. | Stanley Black & Decker, Inc. |
|---|---|---|
| Wednesday, January 1, 2014 | 355858000 | 1975400000 |
| Thursday, January 1, 2015 | 362095000 | 1741900000 |
| Friday, January 1, 2016 | 395913000 | 1810200000 |
| Sunday, January 1, 2017 | 478459000 | 2196000000 |
| Monday, January 1, 2018 | 489954000 | 1791200000 |
| Tuesday, January 1, 2019 | 556055000 | 1920600000 |
| Wednesday, January 1, 2020 | 601449000 | 2004200000 |
| Friday, January 1, 2021 | 646861000 | 2345500000 |
| Saturday, January 1, 2022 | 682399000 | 942800000 |
| Sunday, January 1, 2023 | 1009017000 | 802700000 |
| Monday, January 1, 2024 | 286300000 |
Cracking the code
In the ever-evolving landscape of industrial giants, EMCOR Group, Inc. and Stanley Black & Decker, Inc. have showcased intriguing financial trajectories over the past decade. From 2014 to 2023, EMCOR Group's EBITDA has surged by approximately 183%, reflecting its robust growth strategy and operational efficiency. In contrast, Stanley Black & Decker experienced a more volatile journey, with a notable peak in 2021, followed by a significant decline of around 66% by 2023.
This financial narrative highlights EMCOR's consistent upward trend, culminating in a remarkable EBITDA of over $1 billion in 2023. Meanwhile, Stanley Black & Decker's fluctuating performance underscores the challenges faced in maintaining steady growth amidst market dynamics. As these industry leaders navigate the complexities of the global market, their financial stories offer valuable insights into strategic resilience and adaptability.

Annual Revenue Comparison: EMCOR Group, Inc. vs Stanley Black & Decker, Inc.
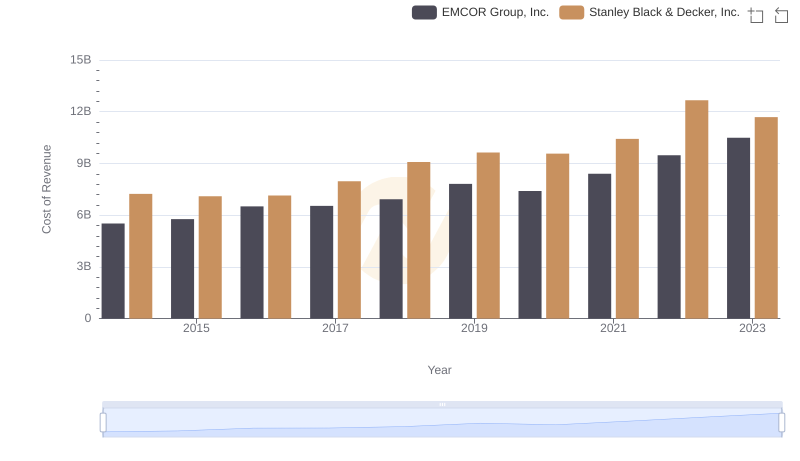
Cost of Revenue Trends: EMCOR Group, Inc. vs Stanley Black & Decker, Inc.
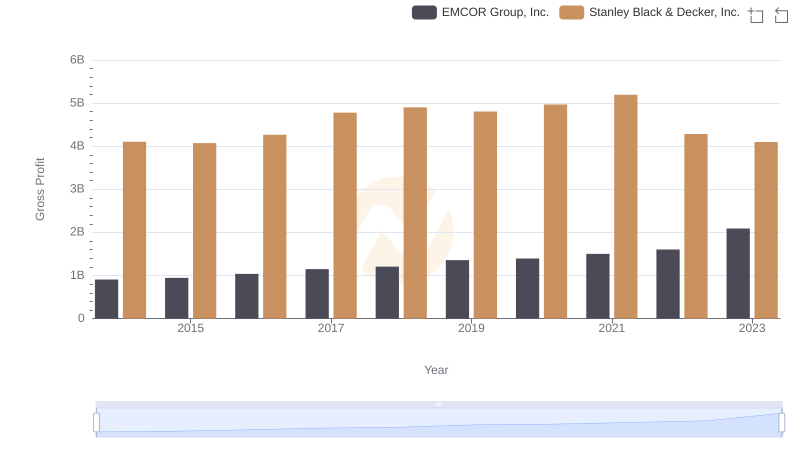
Key Insights on Gross Profit: EMCOR Group, Inc. vs Stanley Black & Decker, Inc.
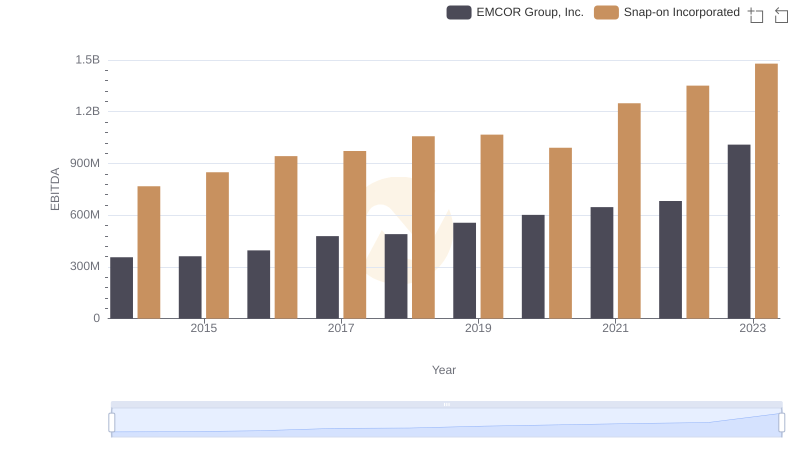
A Professional Review of EBITDA: EMCOR Group, Inc. Compared to Snap-on Incorporated
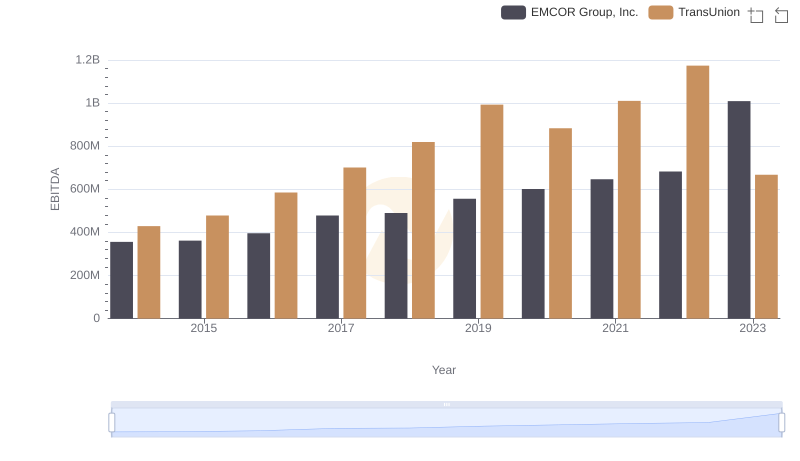
Comprehensive EBITDA Comparison: EMCOR Group, Inc. vs TransUnion
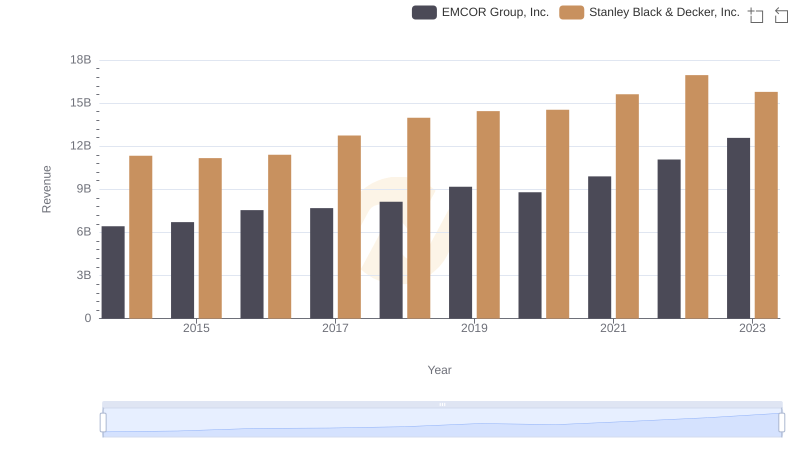
EMCOR Group, Inc. or Stanley Black & Decker, Inc.: Who Leads in Yearly Revenue?

Cost of Revenue: Key Insights for EMCOR Group, Inc. and Stanley Black & Decker, Inc.

Gross Profit Comparison: EMCOR Group, Inc. and Stanley Black & Decker, Inc. Trends
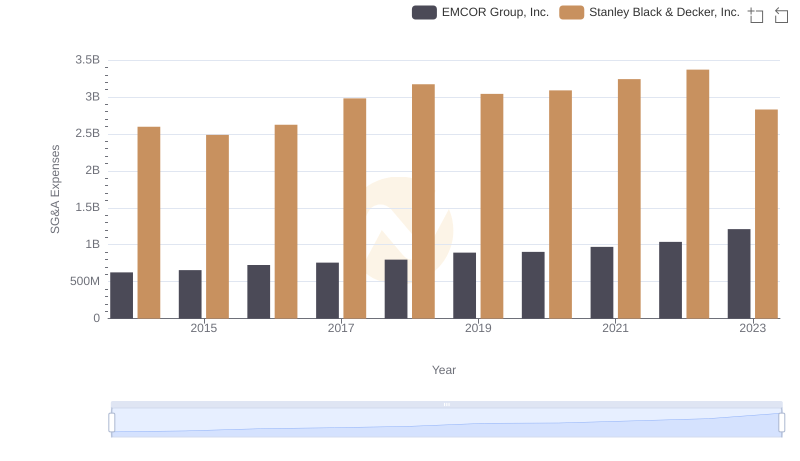
Selling, General, and Administrative Costs: EMCOR Group, Inc. vs Stanley Black & Decker, Inc.
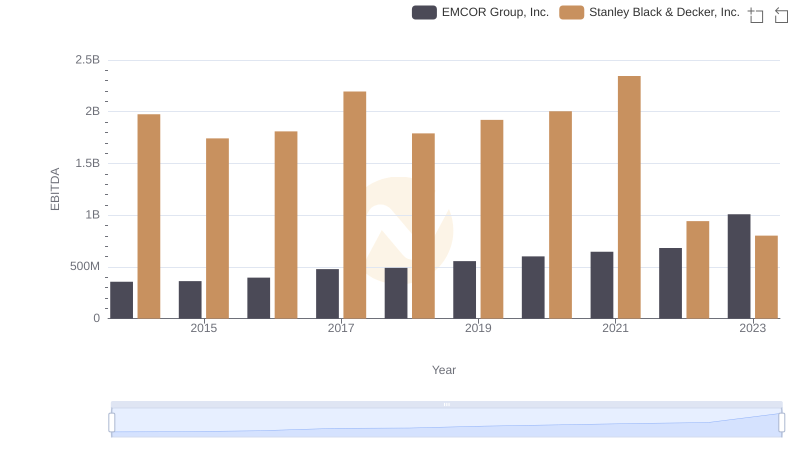
EMCOR Group, Inc. and Stanley Black & Decker, Inc.: A Detailed Examination of EBITDA Performance