| __timestamp | Avery Dennison Corporation | Cintas Corporation |
|---|---|---|
| Wednesday, January 1, 2014 | 629200000 | 793811000 |
| Thursday, January 1, 2015 | 657700000 | 877761000 |
| Friday, January 1, 2016 | 717000000 | 933728000 |
| Sunday, January 1, 2017 | 829400000 | 968293000 |
| Monday, January 1, 2018 | 794300000 | 1227852000 |
| Tuesday, January 1, 2019 | 557500000 | 1564228000 |
| Wednesday, January 1, 2020 | 1062000000 | 1542737000 |
| Friday, January 1, 2021 | 1306900000 | 1773591000 |
| Saturday, January 1, 2022 | 1374100000 | 1990046000 |
| Sunday, January 1, 2023 | 1112100000 | 2221676000 |
| Monday, January 1, 2024 | 1382700000 | 2523857000 |
Unleashing the power of data
In the ever-evolving landscape of corporate finance, EBITDA serves as a crucial indicator of a company's operational performance. Over the past decade, Cintas Corporation and Avery Dennison Corporation have showcased intriguing trajectories in their EBITDA growth. From 2014 to 2023, Cintas consistently outperformed Avery Dennison, with a remarkable 180% increase in EBITDA, peaking at approximately $2.22 billion in 2023. In contrast, Avery Dennison experienced a more modest growth of around 77%, reaching its highest EBITDA of approximately $1.37 billion in 2022.
The data reveals a significant divergence in 2019, where Cintas surged ahead, maintaining a steady upward trend. Meanwhile, Avery Dennison faced fluctuations, notably in 2019 and 2023, where data gaps suggest potential challenges. This analysis underscores the dynamic nature of the market and the strategic maneuvers companies must employ to sustain growth.
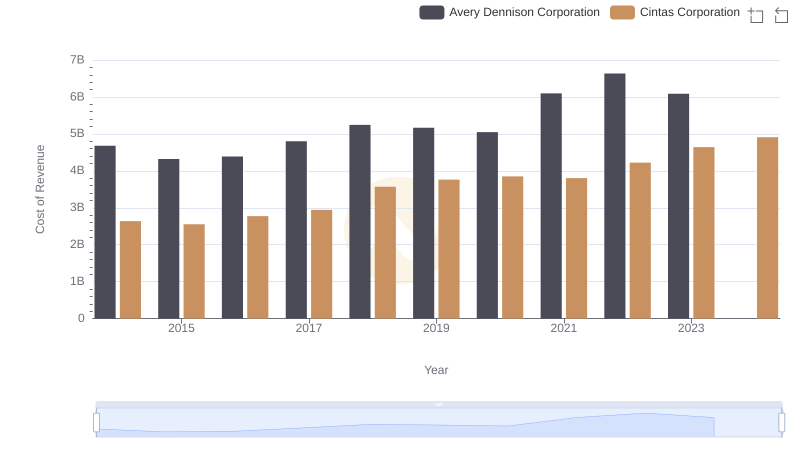
Cost of Revenue: Key Insights for Cintas Corporation and Avery Dennison Corporation
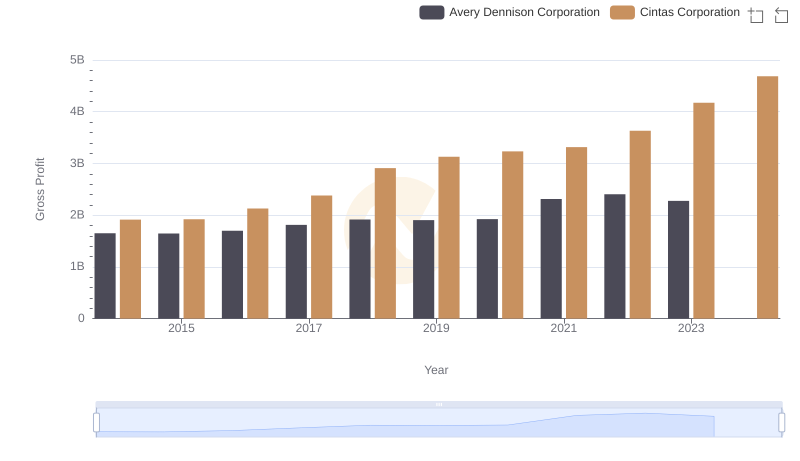
Who Generates Higher Gross Profit? Cintas Corporation or Avery Dennison Corporation
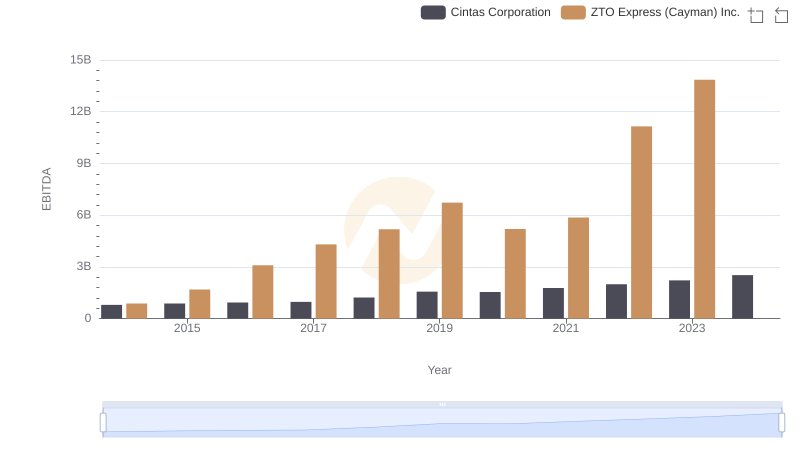
A Side-by-Side Analysis of EBITDA: Cintas Corporation and ZTO Express (Cayman) Inc.
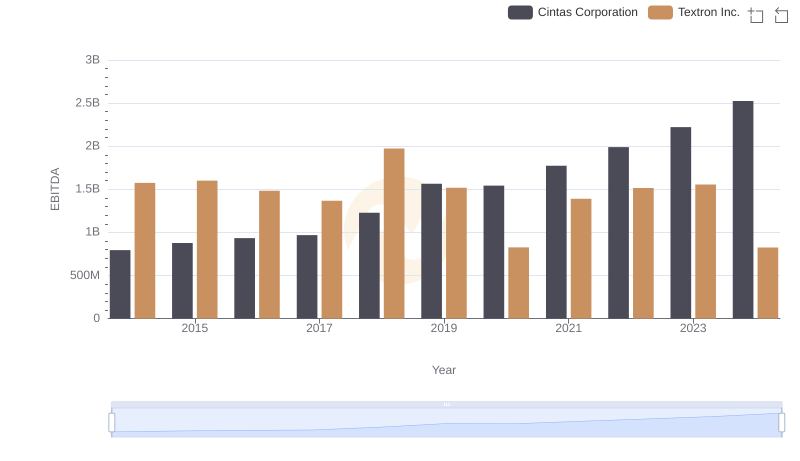
Comparative EBITDA Analysis: Cintas Corporation vs Textron Inc.
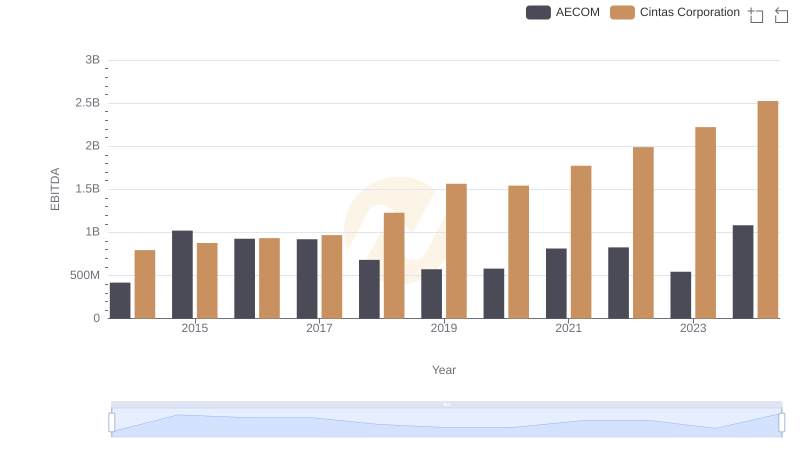
Professional EBITDA Benchmarking: Cintas Corporation vs AECOM
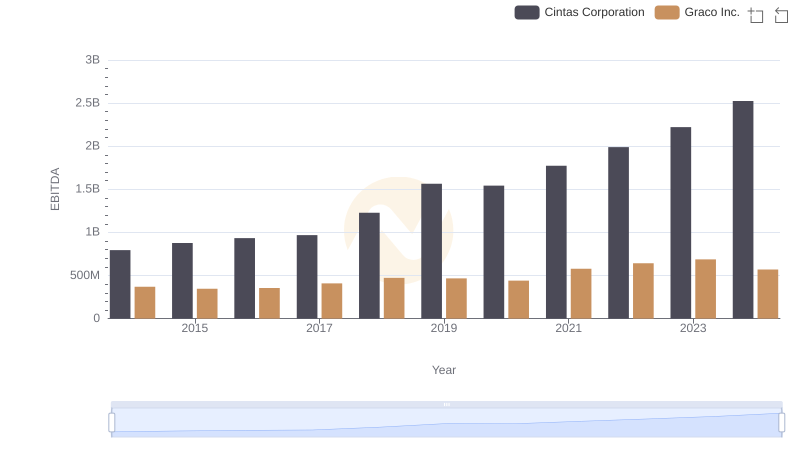
Comprehensive EBITDA Comparison: Cintas Corporation vs Graco Inc.
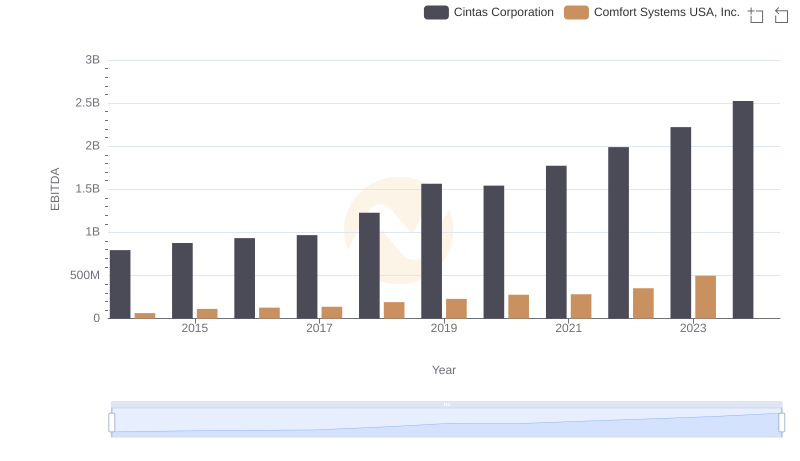
EBITDA Performance Review: Cintas Corporation vs Comfort Systems USA, Inc.
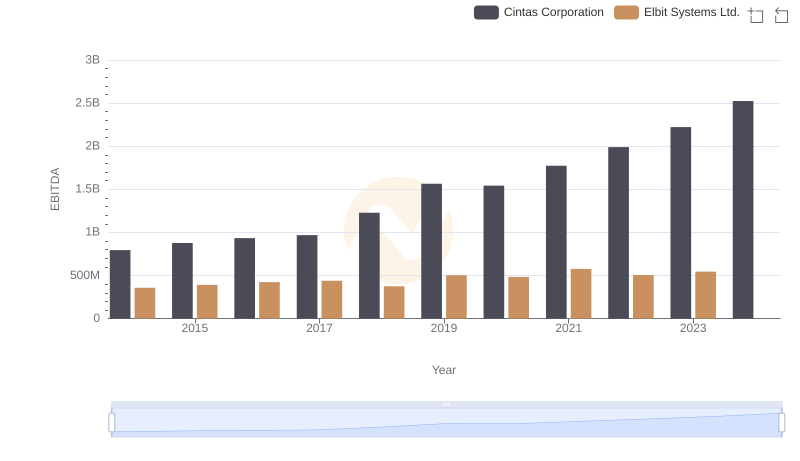
Comprehensive EBITDA Comparison: Cintas Corporation vs Elbit Systems Ltd.