| __timestamp | Cintas Corporation | Comfort Systems USA, Inc. |
|---|---|---|
| Wednesday, January 1, 2014 | 793811000 | 63455000 |
| Thursday, January 1, 2015 | 877761000 | 112580000 |
| Friday, January 1, 2016 | 933728000 | 126974000 |
| Sunday, January 1, 2017 | 968293000 | 137151000 |
| Monday, January 1, 2018 | 1227852000 | 191982000 |
| Tuesday, January 1, 2019 | 1564228000 | 229518000 |
| Wednesday, January 1, 2020 | 1542737000 | 276904000 |
| Friday, January 1, 2021 | 1773591000 | 282506000 |
| Saturday, January 1, 2022 | 1990046000 | 352446000 |
| Sunday, January 1, 2023 | 2221676000 | 497652000 |
| Monday, January 1, 2024 | 2523857000 |
Unveiling the hidden dimensions of data
In the competitive landscape of corporate America, Cintas Corporation and Comfort Systems USA, Inc. have showcased remarkable EBITDA growth over the past decade. Since 2014, Cintas has consistently outperformed, with its EBITDA soaring by over 200%, reaching a peak in 2024. This growth trajectory highlights Cintas's robust business model and strategic market positioning.
Conversely, Comfort Systems USA, Inc. has demonstrated a steady, albeit more modest, growth of approximately 680% from 2014 to 2023. Despite this impressive increase, the company's EBITDA remains significantly lower than that of Cintas, underscoring the competitive challenges it faces in scaling its operations.
The data reveals a compelling narrative of two companies navigating the complexities of their respective industries, with Cintas emerging as a dominant force. As we look to the future, the absence of 2024 data for Comfort Systems USA, Inc. leaves room for speculation on its next strategic move.
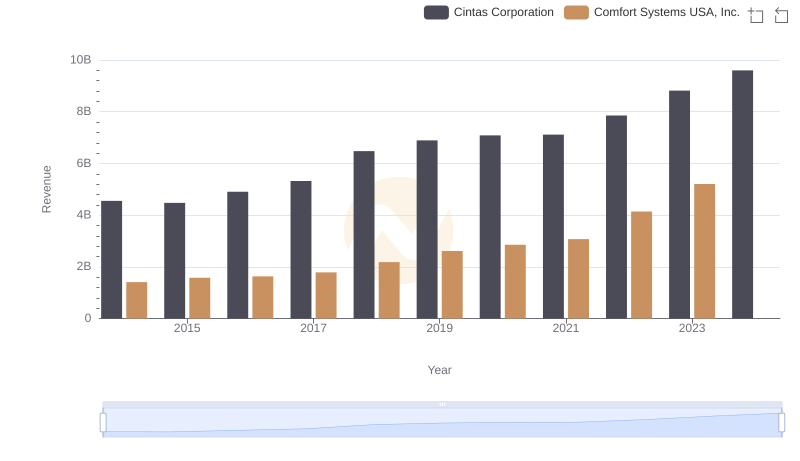
Cintas Corporation and Comfort Systems USA, Inc.: A Comprehensive Revenue Analysis
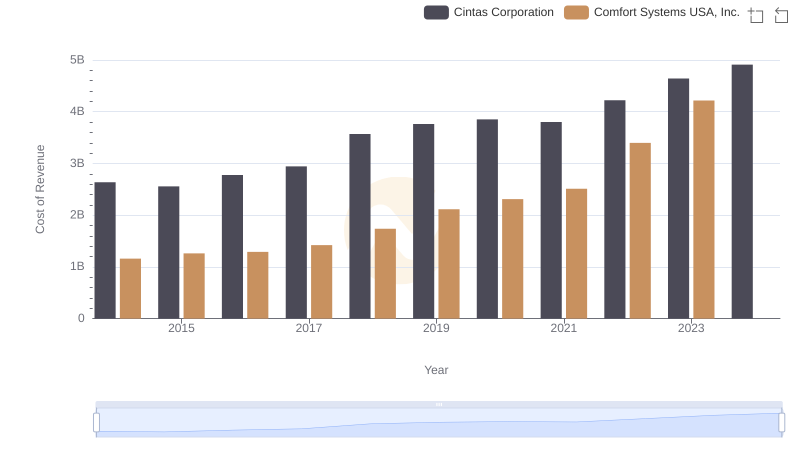
Cost of Revenue Comparison: Cintas Corporation vs Comfort Systems USA, Inc.

Key Insights on Gross Profit: Cintas Corporation vs Comfort Systems USA, Inc.

Breaking Down SG&A Expenses: Cintas Corporation vs Comfort Systems USA, Inc.
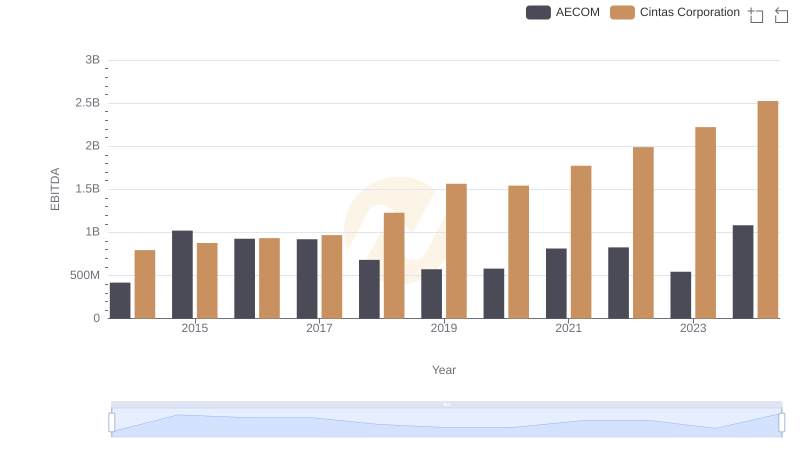
Professional EBITDA Benchmarking: Cintas Corporation vs AECOM
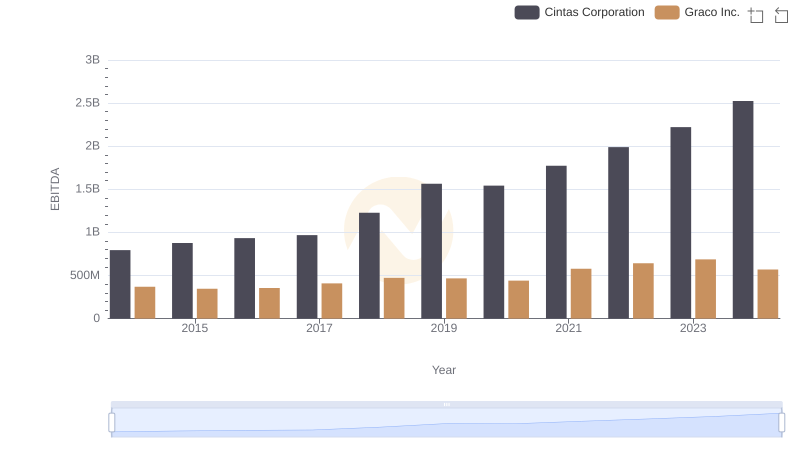
Comprehensive EBITDA Comparison: Cintas Corporation vs Graco Inc.
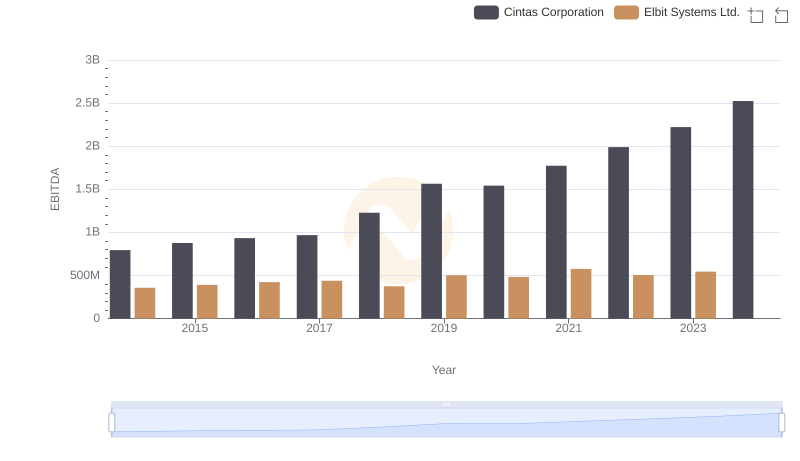
Comprehensive EBITDA Comparison: Cintas Corporation vs Elbit Systems Ltd.
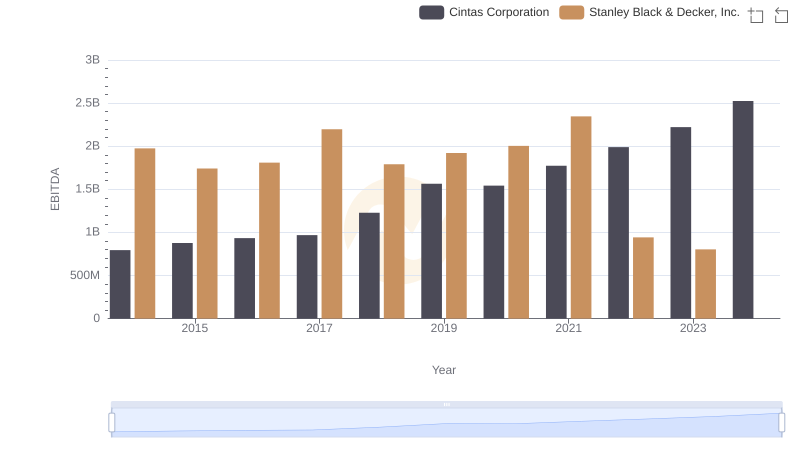
Comprehensive EBITDA Comparison: Cintas Corporation vs Stanley Black & Decker, Inc.
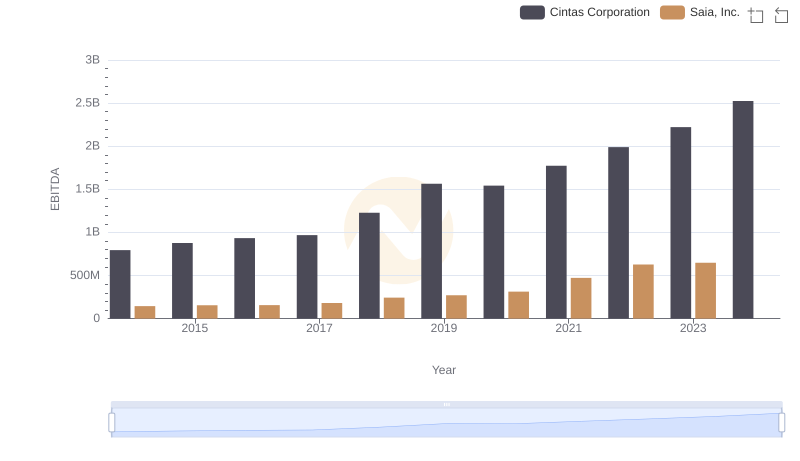
Cintas Corporation and Saia, Inc.: A Detailed Examination of EBITDA Performance
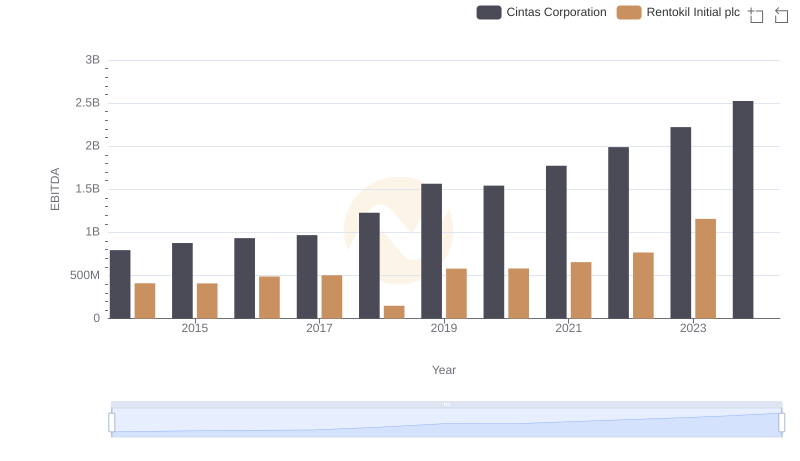
Comparative EBITDA Analysis: Cintas Corporation vs Rentokil Initial plc