| __timestamp | Cintas Corporation | Textron Inc. |
|---|---|---|
| Wednesday, January 1, 2014 | 793811000 | 1575000000 |
| Thursday, January 1, 2015 | 877761000 | 1601000000 |
| Friday, January 1, 2016 | 933728000 | 1484000000 |
| Sunday, January 1, 2017 | 968293000 | 1367000000 |
| Monday, January 1, 2018 | 1227852000 | 1974000000 |
| Tuesday, January 1, 2019 | 1564228000 | 1518000000 |
| Wednesday, January 1, 2020 | 1542737000 | 827000000 |
| Friday, January 1, 2021 | 1773591000 | 1391000000 |
| Saturday, January 1, 2022 | 1990046000 | 1515000000 |
| Sunday, January 1, 2023 | 2221676000 | 1556000000 |
| Monday, January 1, 2024 | 2523857000 | 1422000000 |
Infusing magic into the data realm
In the competitive landscape of American industry, Cintas Corporation and Textron Inc. have showcased intriguing financial trajectories over the past decade. From 2014 to 2024, Cintas Corporation's EBITDA has surged by over 200%, reflecting its robust operational efficiency and strategic growth initiatives. In contrast, Textron Inc. experienced a more volatile journey, with a notable dip in 2020, where its EBITDA fell by nearly 50% compared to its 2018 peak.
Cintas's consistent upward trend, peaking in 2024, underscores its resilience and adaptability in a dynamic market. Meanwhile, Textron's fluctuating performance highlights the challenges faced by diversified industrial conglomerates. As we look towards the future, these trends offer valuable insights into the strategic maneuvers and market conditions that shape the financial health of leading corporations.
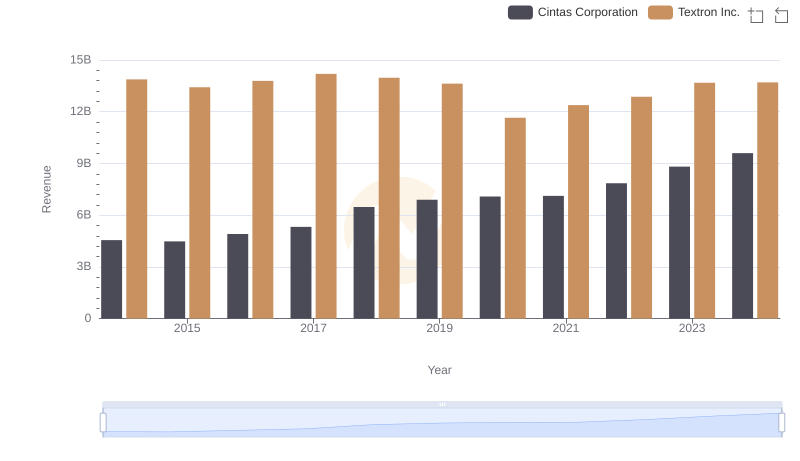
Cintas Corporation vs Textron Inc.: Annual Revenue Growth Compared
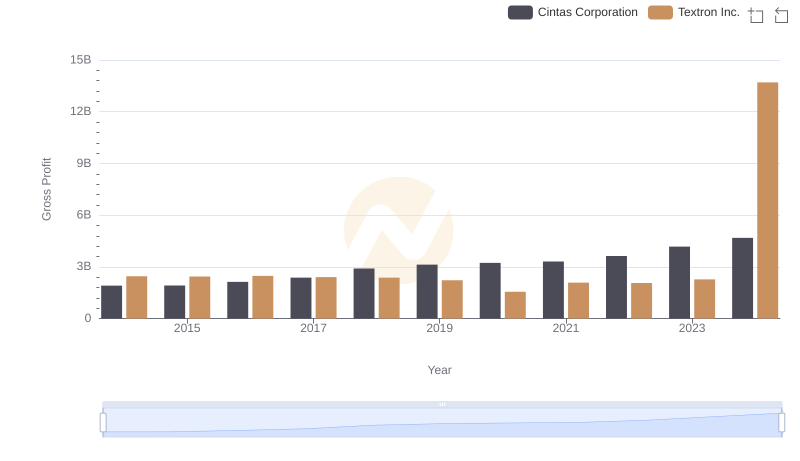
Key Insights on Gross Profit: Cintas Corporation vs Textron Inc.
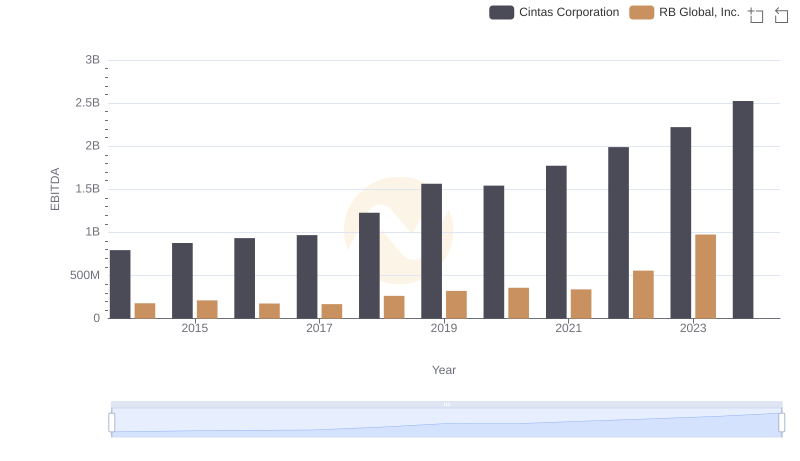
Cintas Corporation and RB Global, Inc.: A Detailed Examination of EBITDA Performance
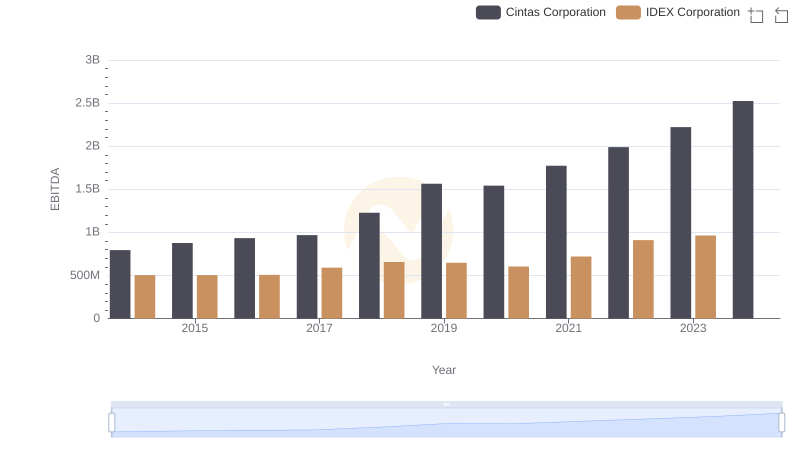
A Side-by-Side Analysis of EBITDA: Cintas Corporation and IDEX Corporation
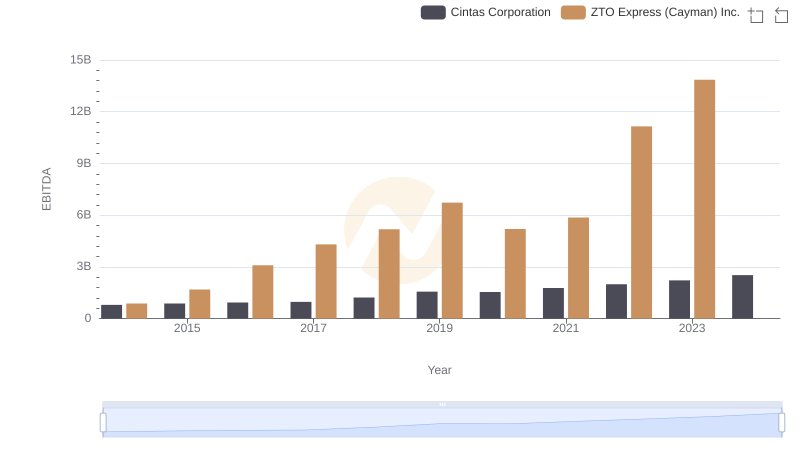
A Side-by-Side Analysis of EBITDA: Cintas Corporation and ZTO Express (Cayman) Inc.

A Side-by-Side Analysis of EBITDA: Cintas Corporation and Avery Dennison Corporation
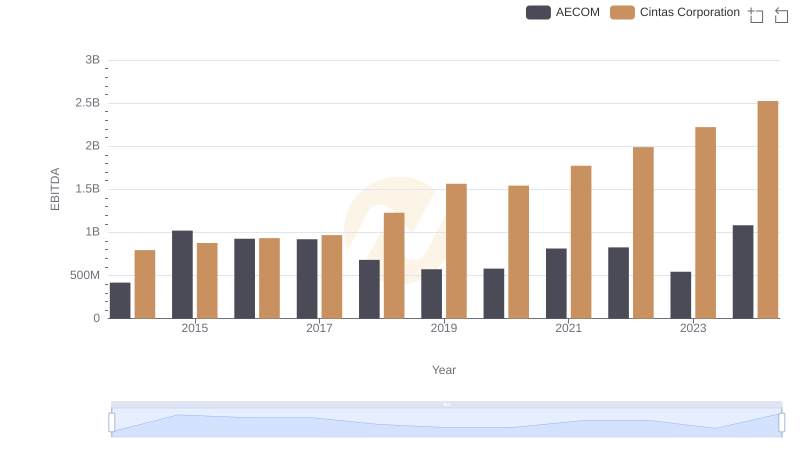
Professional EBITDA Benchmarking: Cintas Corporation vs AECOM
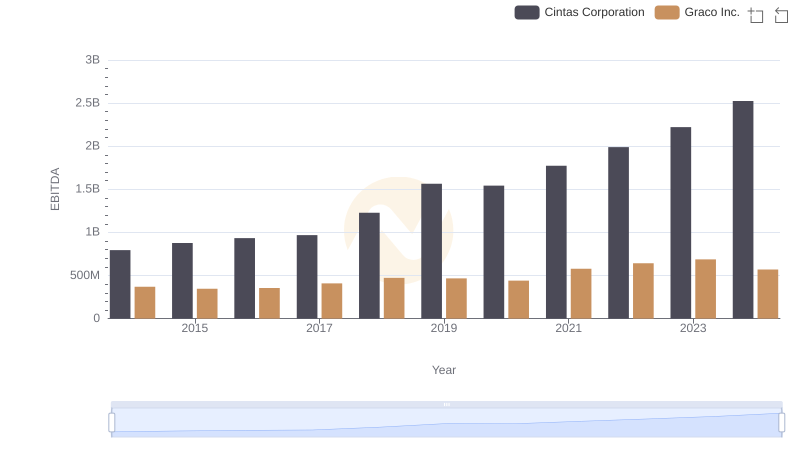
Comprehensive EBITDA Comparison: Cintas Corporation vs Graco Inc.
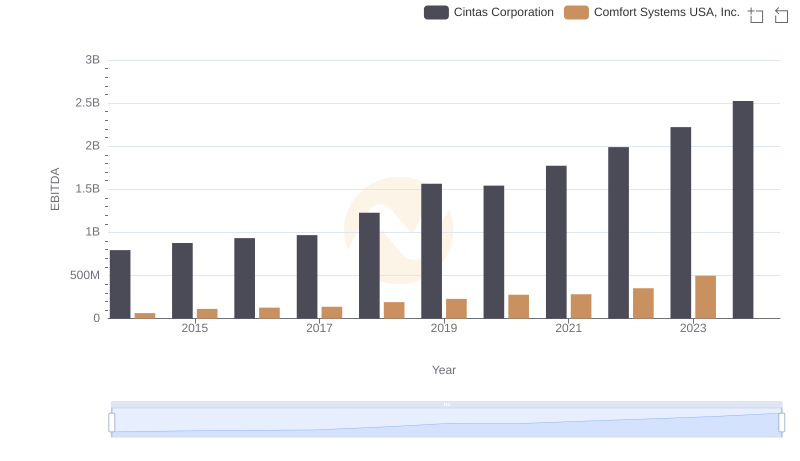
EBITDA Performance Review: Cintas Corporation vs Comfort Systems USA, Inc.