| __timestamp | Cintas Corporation | Stanley Black & Decker, Inc. |
|---|---|---|
| Wednesday, January 1, 2014 | 793811000 | 1975400000 |
| Thursday, January 1, 2015 | 877761000 | 1741900000 |
| Friday, January 1, 2016 | 933728000 | 1810200000 |
| Sunday, January 1, 2017 | 968293000 | 2196000000 |
| Monday, January 1, 2018 | 1227852000 | 1791200000 |
| Tuesday, January 1, 2019 | 1564228000 | 1920600000 |
| Wednesday, January 1, 2020 | 1542737000 | 2004200000 |
| Friday, January 1, 2021 | 1773591000 | 2345500000 |
| Saturday, January 1, 2022 | 1990046000 | 942800000 |
| Sunday, January 1, 2023 | 2221676000 | 802700000 |
| Monday, January 1, 2024 | 2523857000 | 286300000 |
Infusing magic into the data realm
In the ever-evolving landscape of corporate finance, EBITDA serves as a crucial metric for evaluating a company's operational performance. Over the past decade, Cintas Corporation and Stanley Black & Decker, Inc. have showcased intriguing trends in their EBITDA figures.
From 2014 to 2023, Cintas Corporation has demonstrated a remarkable upward trajectory, with EBITDA growing by approximately 218%. This consistent growth reflects the company's robust operational strategies and market adaptability.
Conversely, Stanley Black & Decker experienced a more volatile journey. While their EBITDA peaked in 2021, it saw a significant decline of over 60% by 2023, highlighting potential challenges in maintaining operational efficiency.
This comparative analysis underscores the importance of strategic agility and market responsiveness in sustaining financial health over time.
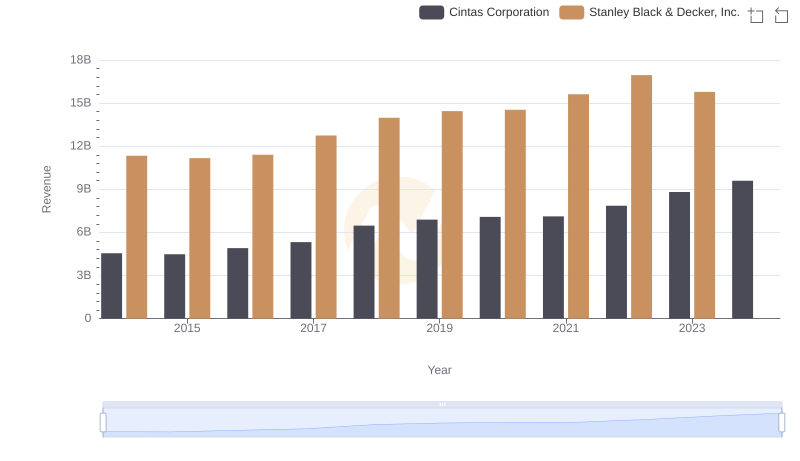
Cintas Corporation or Stanley Black & Decker, Inc.: Who Leads in Yearly Revenue?

Cost of Revenue: Key Insights for Cintas Corporation and Stanley Black & Decker, Inc.

Key Insights on Gross Profit: Cintas Corporation vs Stanley Black & Decker, Inc.

Operational Costs Compared: SG&A Analysis of Cintas Corporation and Stanley Black & Decker, Inc.
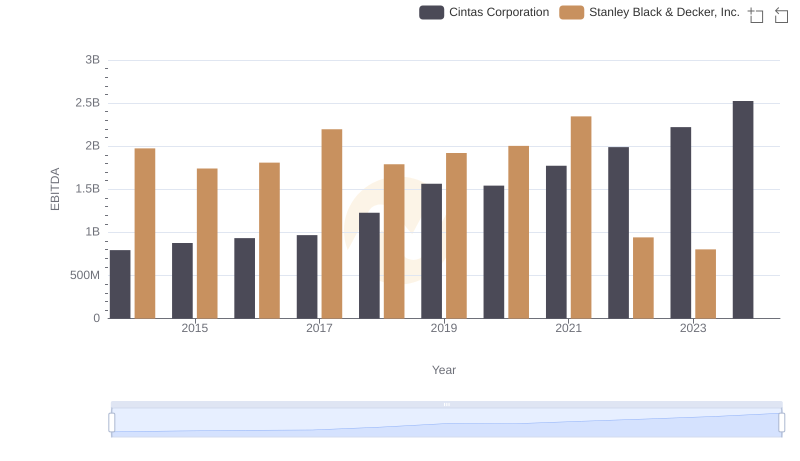
Cintas Corporation vs Stanley Black & Decker, Inc.: In-Depth EBITDA Performance Comparison

Breaking Down Revenue Trends: Cintas Corporation vs Stanley Black & Decker, Inc.
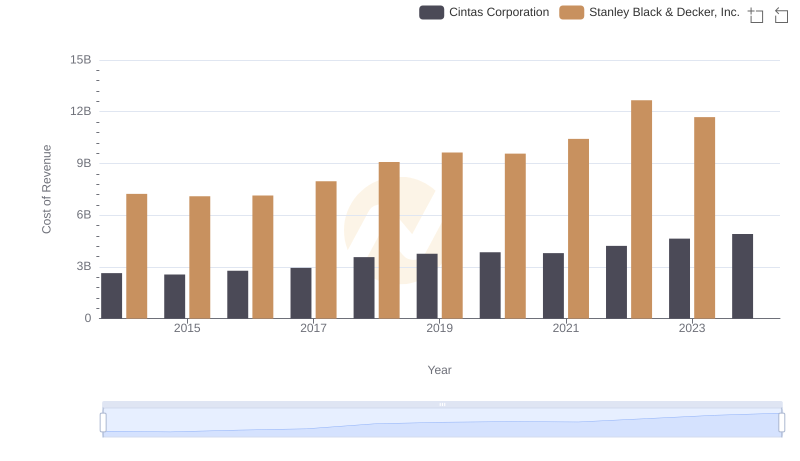
Analyzing Cost of Revenue: Cintas Corporation and Stanley Black & Decker, Inc.
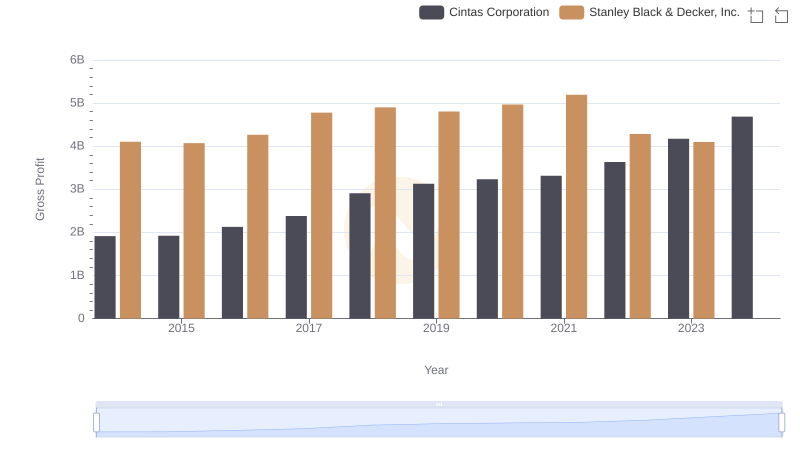
Key Insights on Gross Profit: Cintas Corporation vs Stanley Black & Decker, Inc.
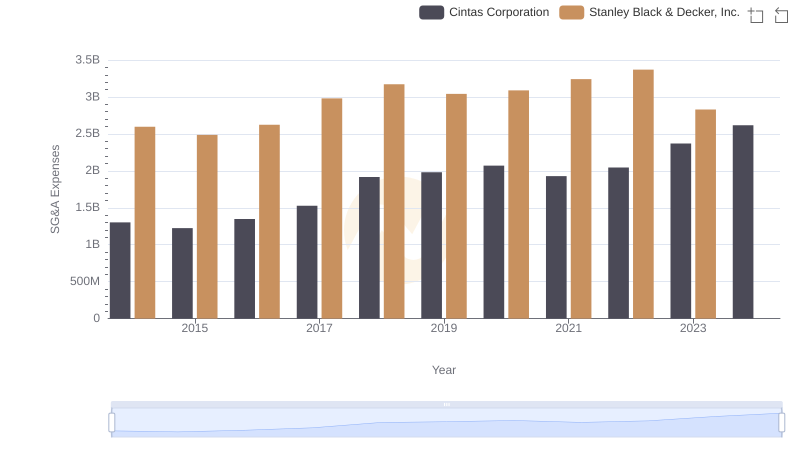
Cintas Corporation or Stanley Black & Decker, Inc.: Who Manages SG&A Costs Better?
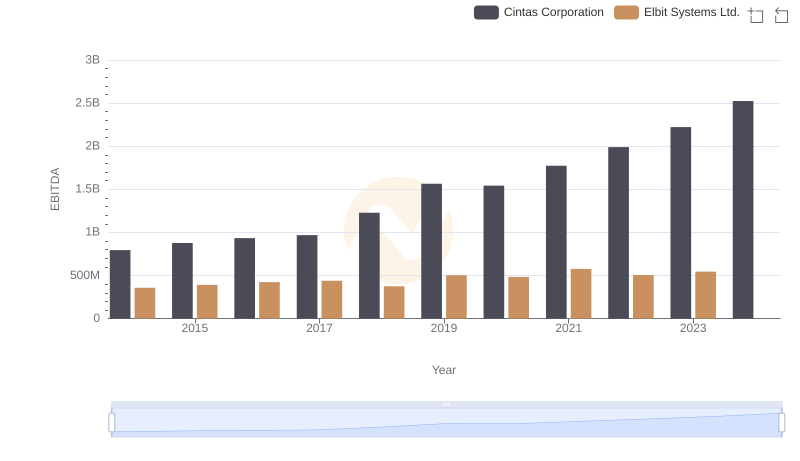
Comprehensive EBITDA Comparison: Cintas Corporation vs Elbit Systems Ltd.
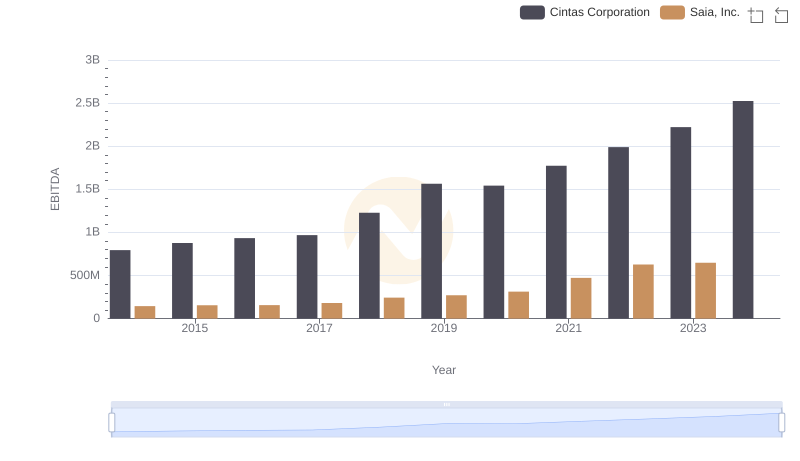
Cintas Corporation and Saia, Inc.: A Detailed Examination of EBITDA Performance
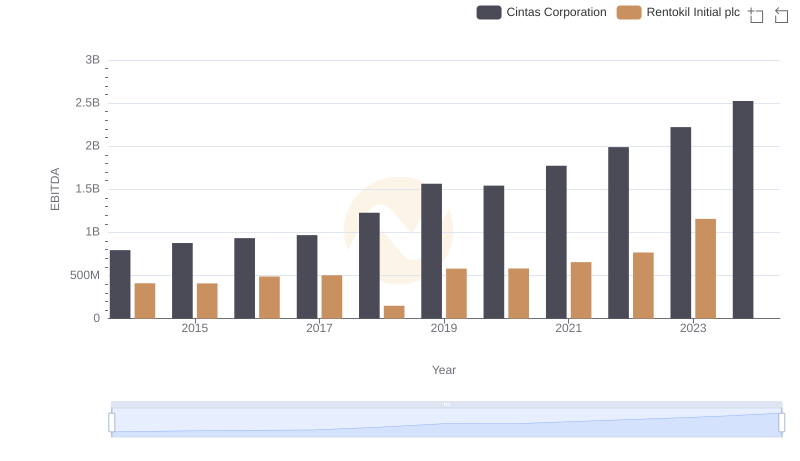
Comparative EBITDA Analysis: Cintas Corporation vs Rentokil Initial plc