| __timestamp | Cintas Corporation | ZTO Express (Cayman) Inc. |
|---|---|---|
| Wednesday, January 1, 2014 | 793811000 | 876815000 |
| Thursday, January 1, 2015 | 877761000 | 1687285000 |
| Friday, January 1, 2016 | 933728000 | 3093956000 |
| Sunday, January 1, 2017 | 968293000 | 4308801000 |
| Monday, January 1, 2018 | 1227852000 | 5185941000 |
| Tuesday, January 1, 2019 | 1564228000 | 6727397000 |
| Wednesday, January 1, 2020 | 1542737000 | 5197064000 |
| Friday, January 1, 2021 | 1773591000 | 5866901000 |
| Saturday, January 1, 2022 | 1990046000 | 11147519000 |
| Sunday, January 1, 2023 | 2221676000 | 13853443000 |
| Monday, January 1, 2024 | 2523857000 |
Unveiling the hidden dimensions of data
In the ever-evolving landscape of global business, understanding the financial health of companies is crucial. This analysis delves into the EBITDA growth of two industry giants: Cintas Corporation and ZTO Express (Cayman) Inc., from 2014 to 2023. Over this decade, Cintas Corporation, a leader in corporate identity uniforms, showcased a steady growth trajectory, with its EBITDA increasing by approximately 218%. Meanwhile, ZTO Express, a major player in China's express delivery sector, experienced a staggering growth of over 1,480% in the same period. Notably, ZTO's EBITDA surged from 2014 to 2023, reflecting the booming e-commerce market in China. However, data for 2024 is missing for ZTO, leaving room for speculation about its future performance. This side-by-side analysis highlights the dynamic nature of global markets and the diverse growth strategies of these two companies.
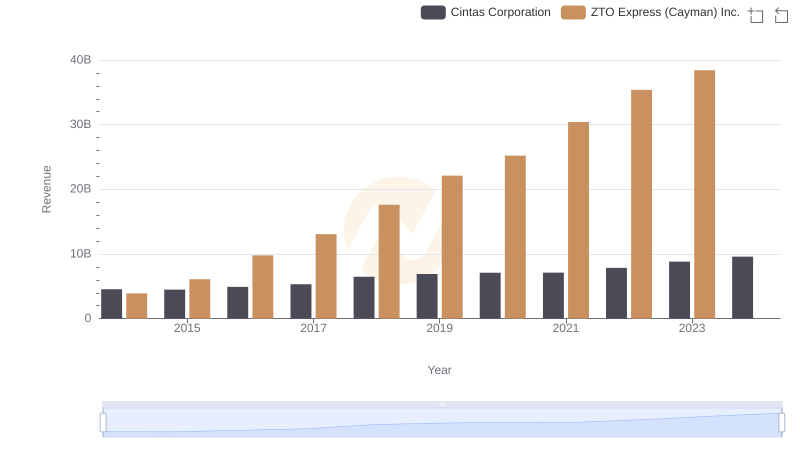
Annual Revenue Comparison: Cintas Corporation vs ZTO Express (Cayman) Inc.
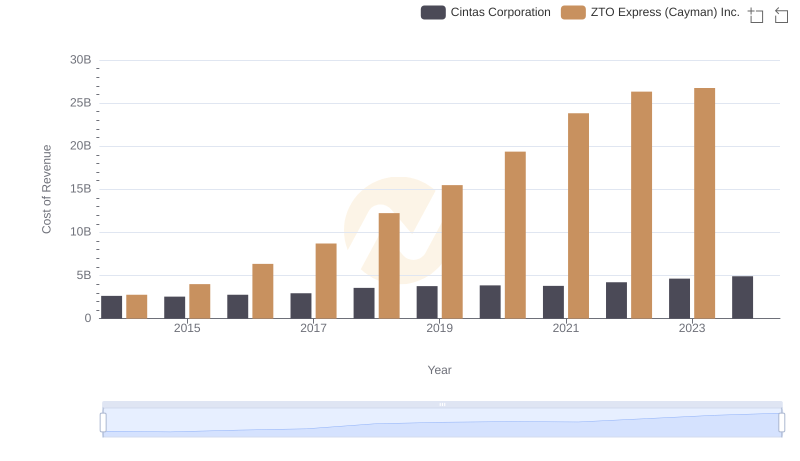
Cost of Revenue Trends: Cintas Corporation vs ZTO Express (Cayman) Inc.
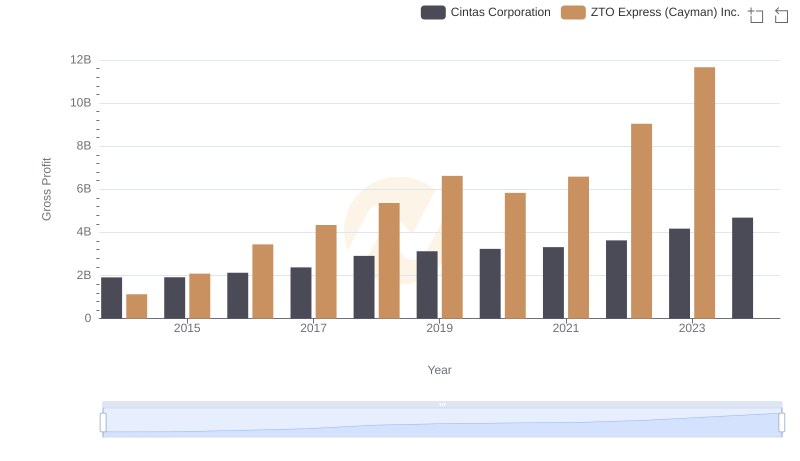
Cintas Corporation vs ZTO Express (Cayman) Inc.: A Gross Profit Performance Breakdown
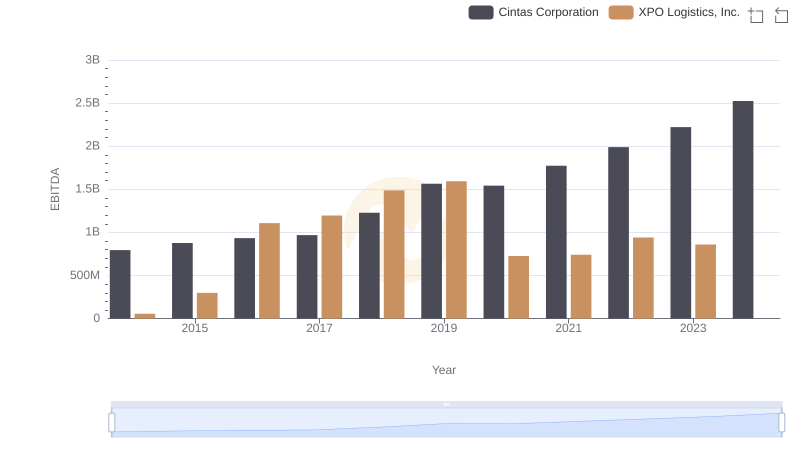
Cintas Corporation and XPO Logistics, Inc.: A Detailed Examination of EBITDA Performance
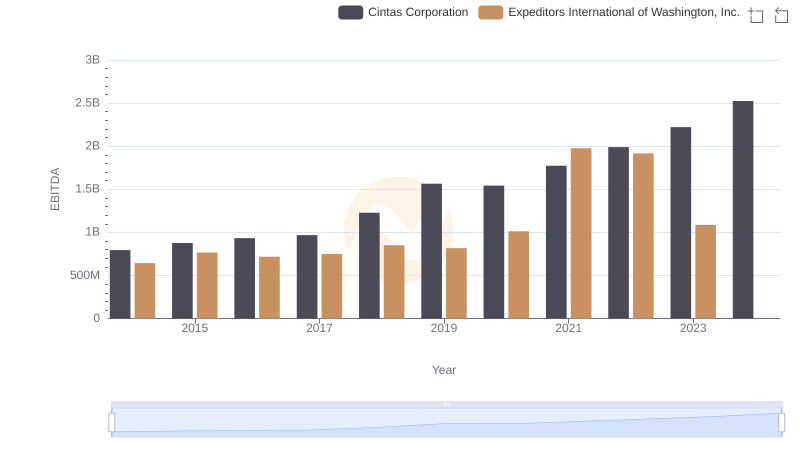
EBITDA Analysis: Evaluating Cintas Corporation Against Expeditors International of Washington, Inc.
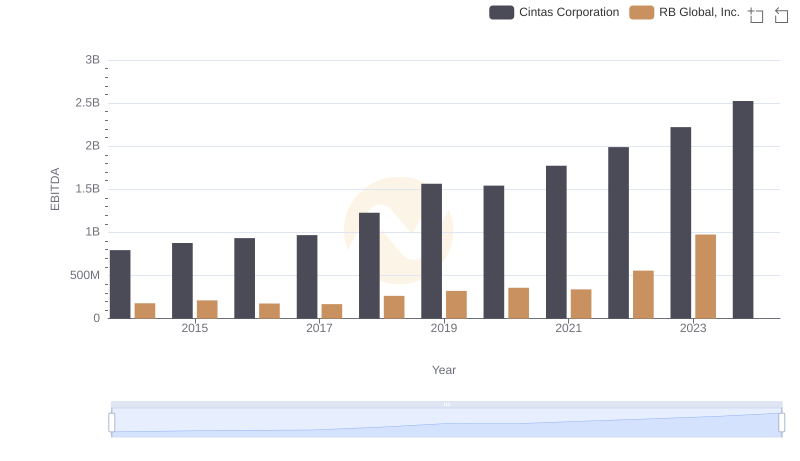
Cintas Corporation and RB Global, Inc.: A Detailed Examination of EBITDA Performance
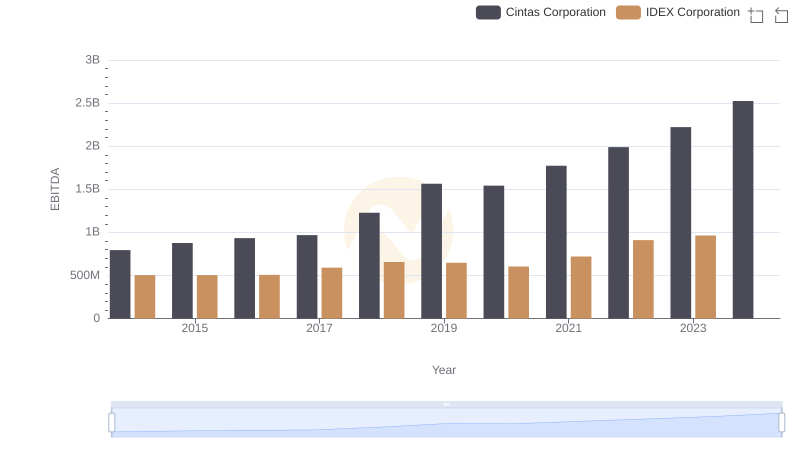
A Side-by-Side Analysis of EBITDA: Cintas Corporation and IDEX Corporation
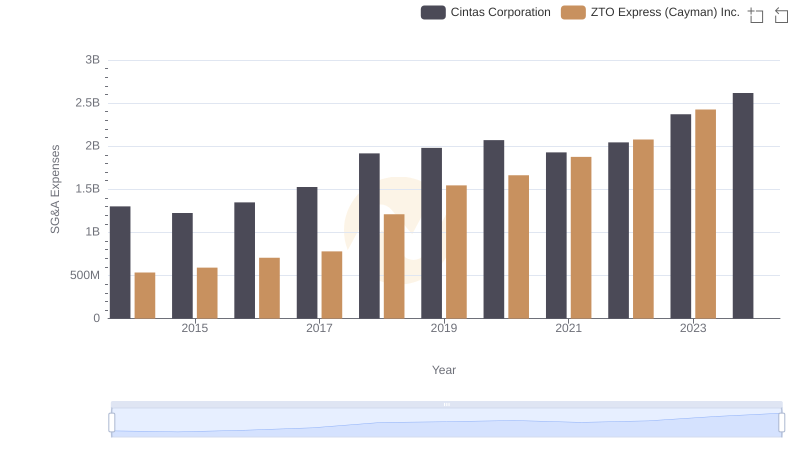
Cost Management Insights: SG&A Expenses for Cintas Corporation and ZTO Express (Cayman) Inc.
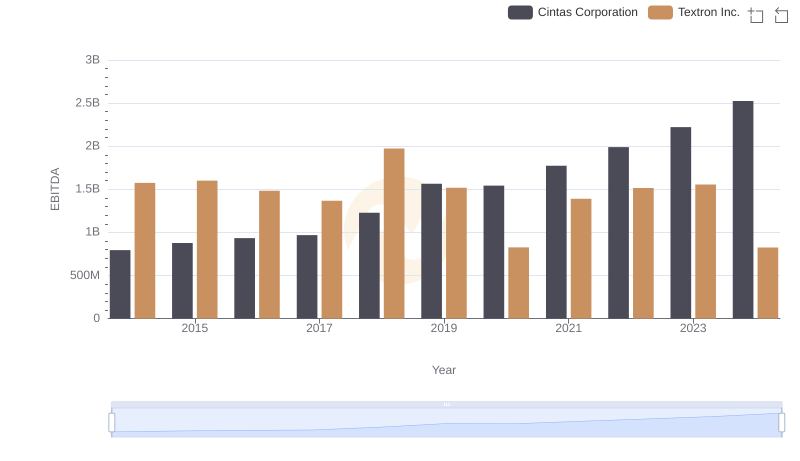
Comparative EBITDA Analysis: Cintas Corporation vs Textron Inc.

A Side-by-Side Analysis of EBITDA: Cintas Corporation and Avery Dennison Corporation