| __timestamp | AerCap Holdings N.V. | Automatic Data Processing, Inc. |
|---|---|---|
| Wednesday, January 1, 2014 | 299900000 | 2762400000 |
| Thursday, January 1, 2015 | 381308000 | 2496900000 |
| Friday, January 1, 2016 | 351012000 | 2637000000 |
| Sunday, January 1, 2017 | 348291000 | 2783200000 |
| Monday, January 1, 2018 | 305226000 | 2971500000 |
| Tuesday, January 1, 2019 | 267458000 | 3064200000 |
| Wednesday, January 1, 2020 | 242161000 | 3003000000 |
| Friday, January 1, 2021 | 317888000 | 3040500000 |
| Saturday, January 1, 2022 | 399530000 | 3233200000 |
| Sunday, January 1, 2023 | 464128000 | 3551400000 |
| Monday, January 1, 2024 | 3778900000 |
Unveiling the hidden dimensions of data
In the ever-evolving landscape of corporate finance, understanding the nuances of Selling, General, and Administrative (SG&A) expenses is crucial. Over the past decade, Automatic Data Processing, Inc. (ADP) and AerCap Holdings N.V. have showcased contrasting trends in their SG&A expenditures. From 2014 to 2023, ADP consistently reported higher SG&A expenses, peaking at approximately $3.55 billion in 2023, marking a 28% increase from 2014. In contrast, AerCap's SG&A expenses, while significantly lower, saw a notable rise of 55% over the same period, reaching around $464 million in 2023. This divergence highlights the distinct operational strategies and market dynamics influencing each company. Notably, the data for 2024 is incomplete, reflecting the dynamic nature of financial reporting. As businesses navigate economic challenges, these insights into SG&A trends offer valuable perspectives for investors and analysts alike.

Revenue Showdown: Automatic Data Processing, Inc. vs AerCap Holdings N.V.
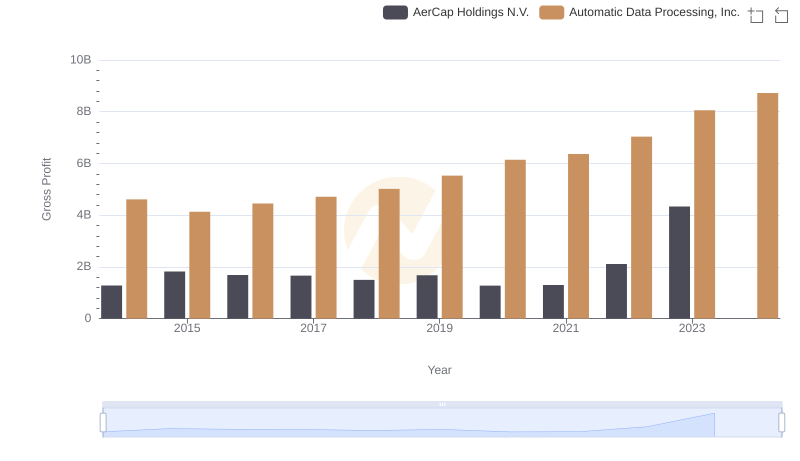
Key Insights on Gross Profit: Automatic Data Processing, Inc. vs AerCap Holdings N.V.
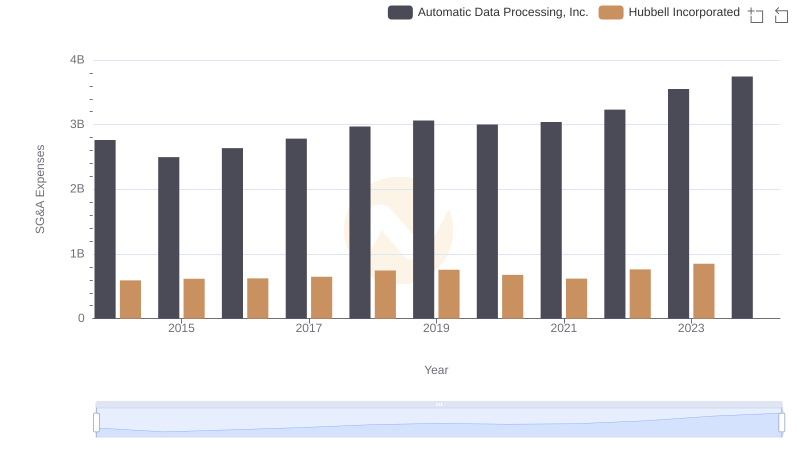
Comparing SG&A Expenses: Automatic Data Processing, Inc. vs Hubbell Incorporated Trends and Insights
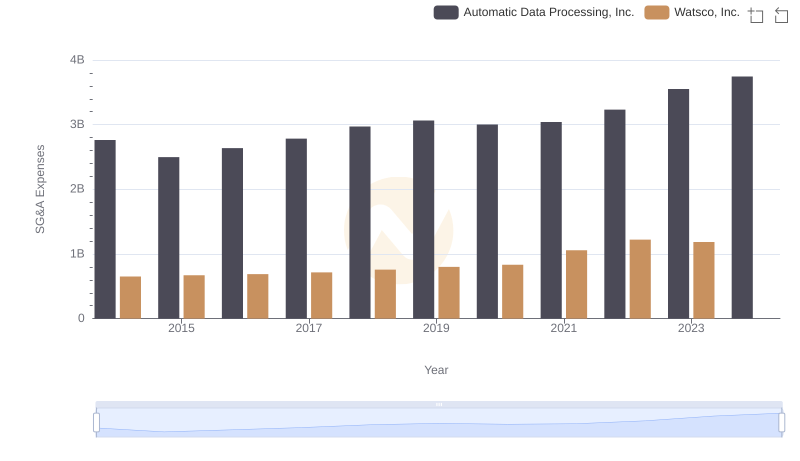
Who Optimizes SG&A Costs Better? Automatic Data Processing, Inc. or Watsco, Inc.

Operational Costs Compared: SG&A Analysis of Automatic Data Processing, Inc. and Snap-on Incorporated
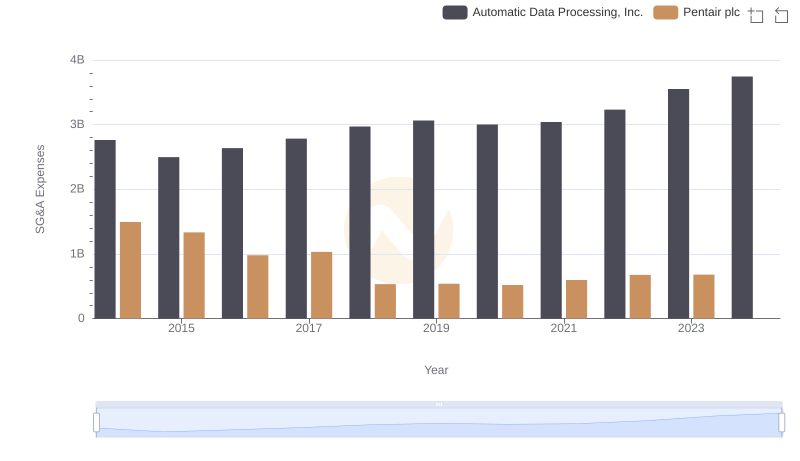
Who Optimizes SG&A Costs Better? Automatic Data Processing, Inc. or Pentair plc
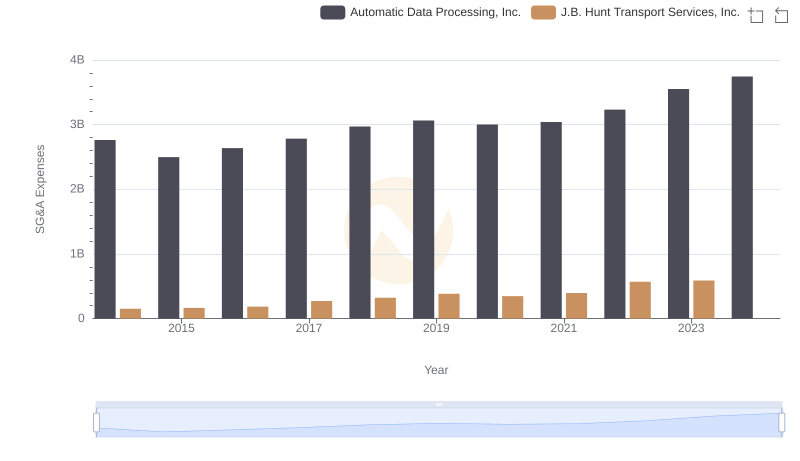
Selling, General, and Administrative Costs: Automatic Data Processing, Inc. vs J.B. Hunt Transport Services, Inc.
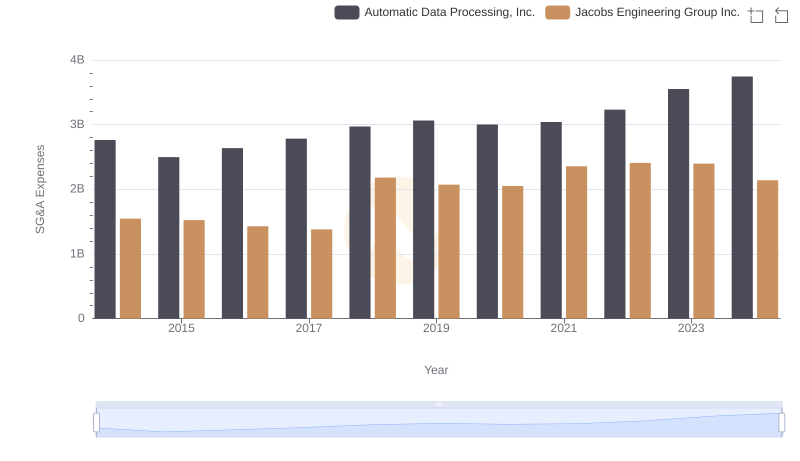
Who Optimizes SG&A Costs Better? Automatic Data Processing, Inc. or Jacobs Engineering Group Inc.
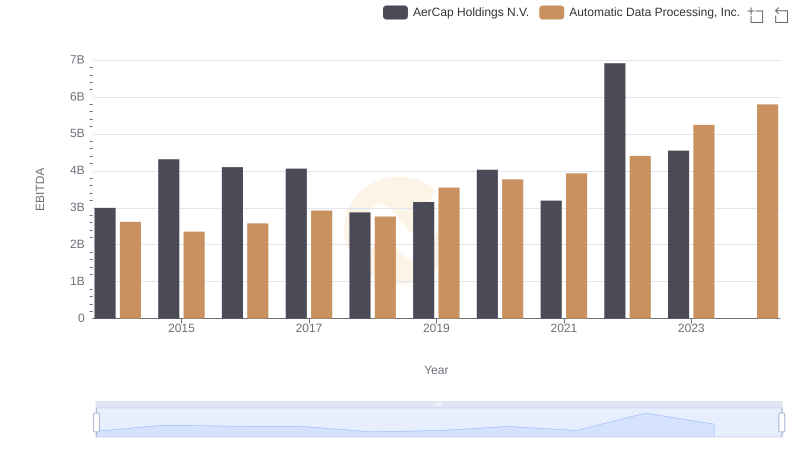
Professional EBITDA Benchmarking: Automatic Data Processing, Inc. vs AerCap Holdings N.V.