| __timestamp | Parker-Hannifin Corporation | Stanley Black & Decker, Inc. |
|---|---|---|
| Wednesday, January 1, 2014 | 13215971000 | 11338600000 |
| Thursday, January 1, 2015 | 12711744000 | 11171800000 |
| Friday, January 1, 2016 | 11360753000 | 11406900000 |
| Sunday, January 1, 2017 | 12029312000 | 12747200000 |
| Monday, January 1, 2018 | 14302392000 | 13982400000 |
| Tuesday, January 1, 2019 | 14320324000 | 14442200000 |
| Wednesday, January 1, 2020 | 13695520000 | 14534600000 |
| Friday, January 1, 2021 | 14347640000 | 15617200000 |
| Saturday, January 1, 2022 | 15861608000 | 16947400000 |
| Sunday, January 1, 2023 | 19065194000 | 15781100000 |
| Monday, January 1, 2024 | 19929606000 | 15365700000 |
Unleashing insights
In the ever-evolving landscape of industrial manufacturing, Parker-Hannifin Corporation and Stanley Black & Decker, Inc. have been pivotal players. From 2014 to 2023, Parker-Hannifin's revenue surged by approximately 51%, peaking in 2023. This growth reflects their strategic expansions and innovations in motion and control technologies. Meanwhile, Stanley Black & Decker experienced a 39% increase in revenue until 2022, showcasing their resilience and adaptability in the tools and storage sector. However, 2023 saw a slight dip, indicating potential market challenges or strategic shifts. Notably, data for 2024 is incomplete for Stanley Black & Decker, suggesting a need for further analysis. These trends highlight the dynamic nature of the industrial sector and the importance of strategic foresight in maintaining competitive advantage.
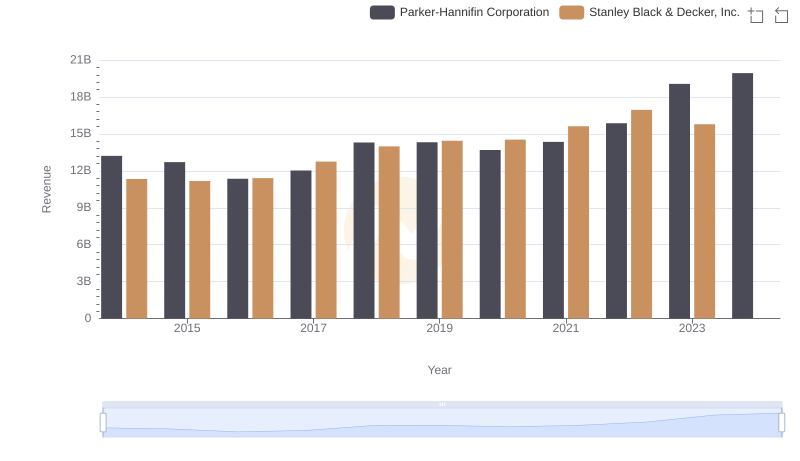
Parker-Hannifin Corporation and Stanley Black & Decker, Inc.: A Comprehensive Revenue Analysis

Cost of Revenue Trends: Parker-Hannifin Corporation vs Stanley Black & Decker, Inc.

Parker-Hannifin Corporation and Stanley Black & Decker, Inc.: A Detailed Gross Profit Analysis

Research and Development Expenses Breakdown: Parker-Hannifin Corporation vs Stanley Black & Decker, Inc.
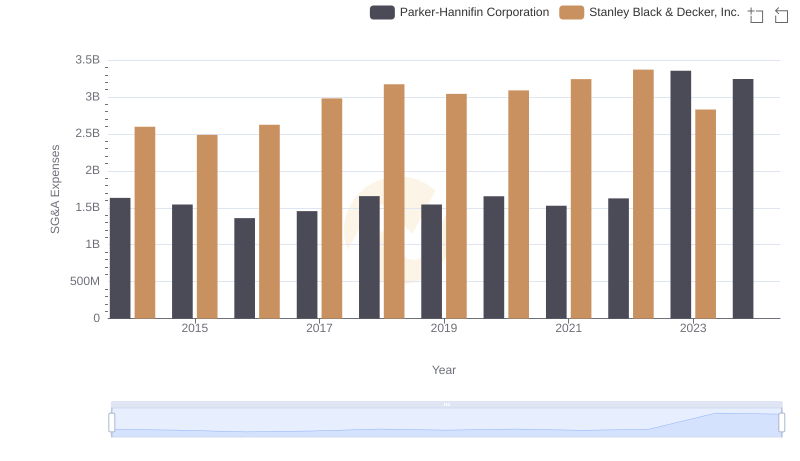
Operational Costs Compared: SG&A Analysis of Parker-Hannifin Corporation and Stanley Black & Decker, Inc.
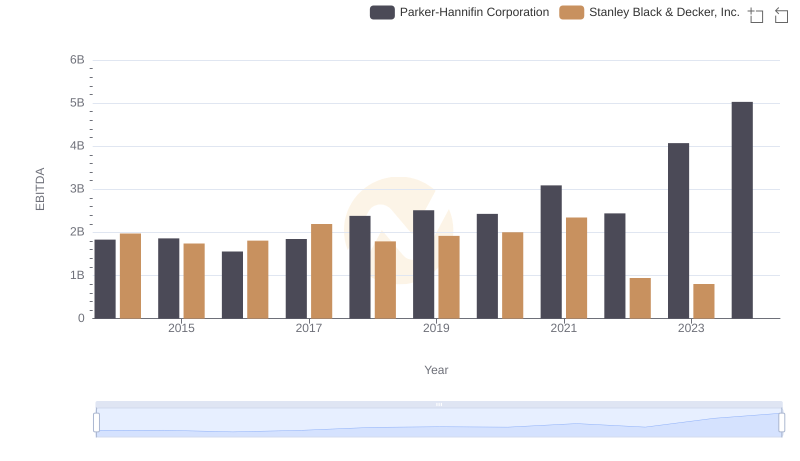
Comparative EBITDA Analysis: Parker-Hannifin Corporation vs Stanley Black & Decker, Inc.
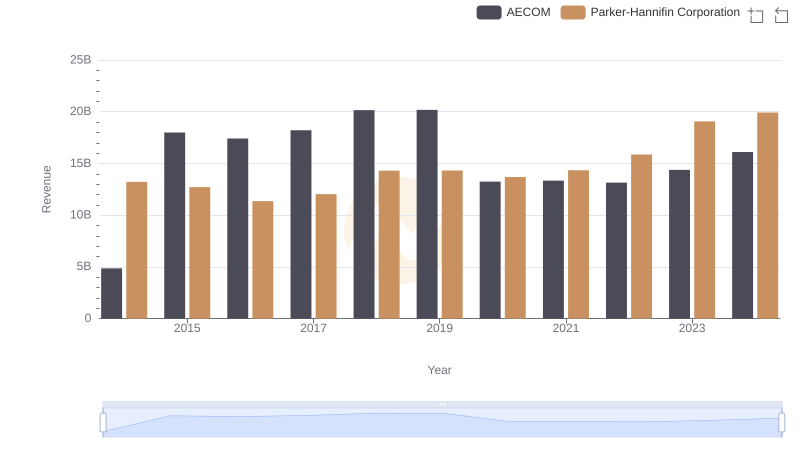
Who Generates More Revenue? Parker-Hannifin Corporation or AECOM
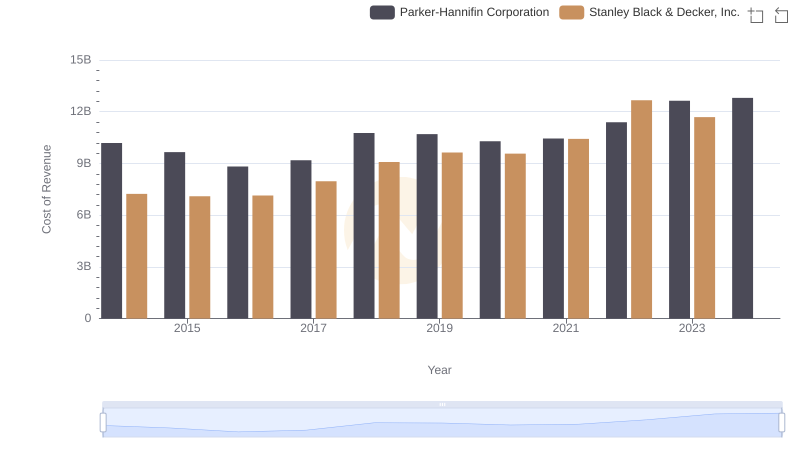
Analyzing Cost of Revenue: Parker-Hannifin Corporation and Stanley Black & Decker, Inc.
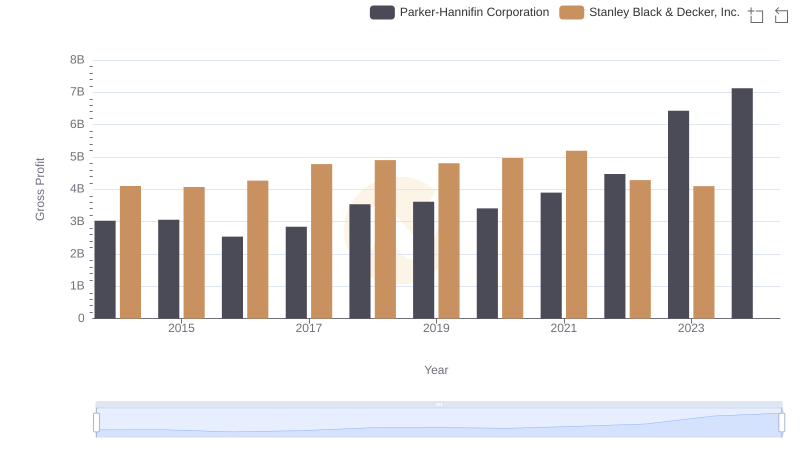
Gross Profit Comparison: Parker-Hannifin Corporation and Stanley Black & Decker, Inc. Trends
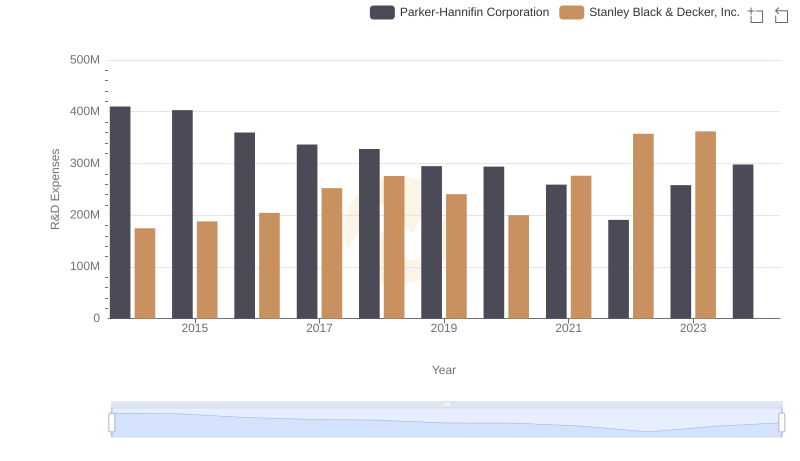
Parker-Hannifin Corporation or Stanley Black & Decker, Inc.: Who Invests More in Innovation?

Parker-Hannifin Corporation vs Stanley Black & Decker, Inc.: In-Depth EBITDA Performance Comparison