| __timestamp | Parker-Hannifin Corporation | Stanley Black & Decker, Inc. |
|---|---|---|
| Wednesday, January 1, 2014 | 13215971000 | 11338600000 |
| Thursday, January 1, 2015 | 12711744000 | 11171800000 |
| Friday, January 1, 2016 | 11360753000 | 11406900000 |
| Sunday, January 1, 2017 | 12029312000 | 12747200000 |
| Monday, January 1, 2018 | 14302392000 | 13982400000 |
| Tuesday, January 1, 2019 | 14320324000 | 14442200000 |
| Wednesday, January 1, 2020 | 13695520000 | 14534600000 |
| Friday, January 1, 2021 | 14347640000 | 15617200000 |
| Saturday, January 1, 2022 | 15861608000 | 16947400000 |
| Sunday, January 1, 2023 | 19065194000 | 15781100000 |
| Monday, January 1, 2024 | 19929606000 | 15365700000 |
Unveiling the hidden dimensions of data
In the ever-evolving landscape of industrial manufacturing, Parker-Hannifin Corporation and Stanley Black & Decker, Inc. have been pivotal players. From 2014 to 2023, Parker-Hannifin's revenue surged by approximately 51%, showcasing its robust growth trajectory. In contrast, Stanley Black & Decker experienced a 39% increase in revenue until 2022, with a slight dip in 2023. This divergence highlights Parker-Hannifin's resilience and adaptability in a competitive market. Notably, 2023 marked a significant year for Parker-Hannifin, with revenues peaking at nearly 20% higher than the previous year, while Stanley Black & Decker faced challenges, resulting in a revenue decline. The absence of data for Stanley Black & Decker in 2024 suggests potential strategic shifts or reporting changes. As these industrial titans navigate the future, their revenue trajectories offer valuable insights into their market strategies and operational efficiencies.
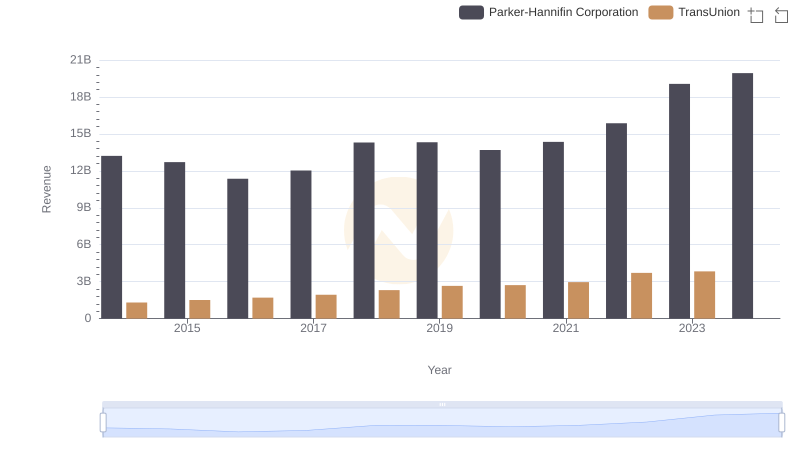
Parker-Hannifin Corporation or TransUnion: Who Leads in Yearly Revenue?

Cost of Revenue Trends: Parker-Hannifin Corporation vs Stanley Black & Decker, Inc.

Parker-Hannifin Corporation and Stanley Black & Decker, Inc.: A Detailed Gross Profit Analysis

Research and Development Expenses Breakdown: Parker-Hannifin Corporation vs Stanley Black & Decker, Inc.
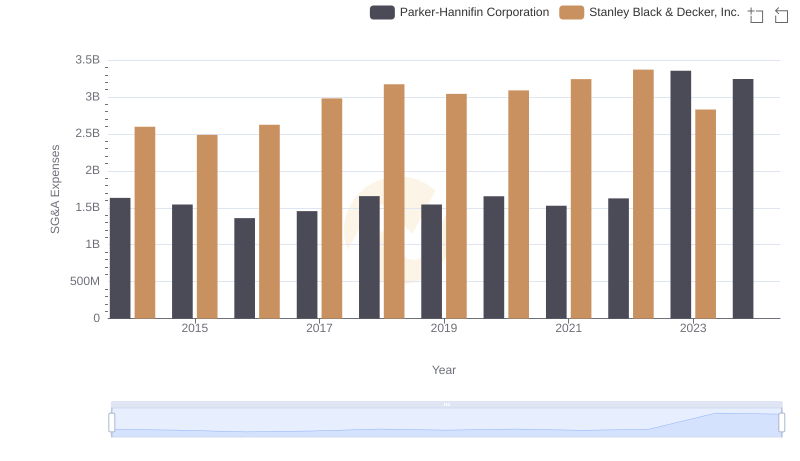
Operational Costs Compared: SG&A Analysis of Parker-Hannifin Corporation and Stanley Black & Decker, Inc.
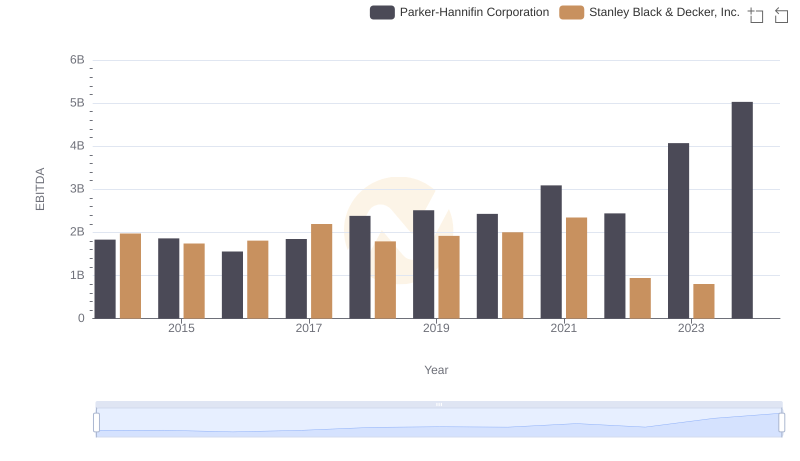
Comparative EBITDA Analysis: Parker-Hannifin Corporation vs Stanley Black & Decker, Inc.
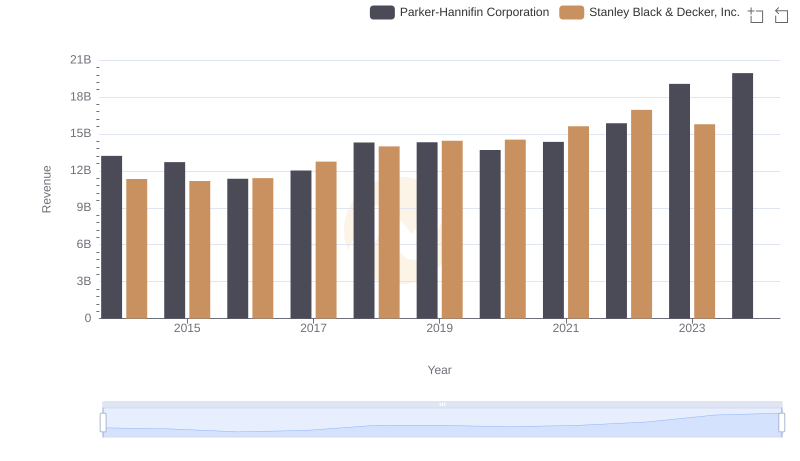
Parker-Hannifin Corporation and Stanley Black & Decker, Inc.: A Comprehensive Revenue Analysis
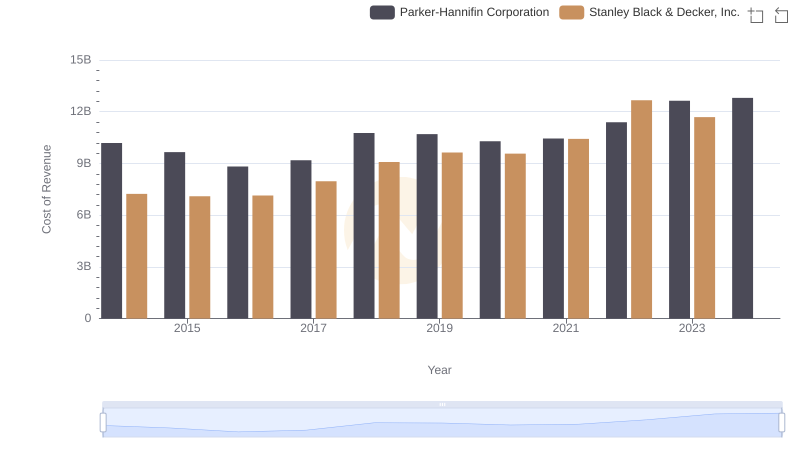
Analyzing Cost of Revenue: Parker-Hannifin Corporation and Stanley Black & Decker, Inc.
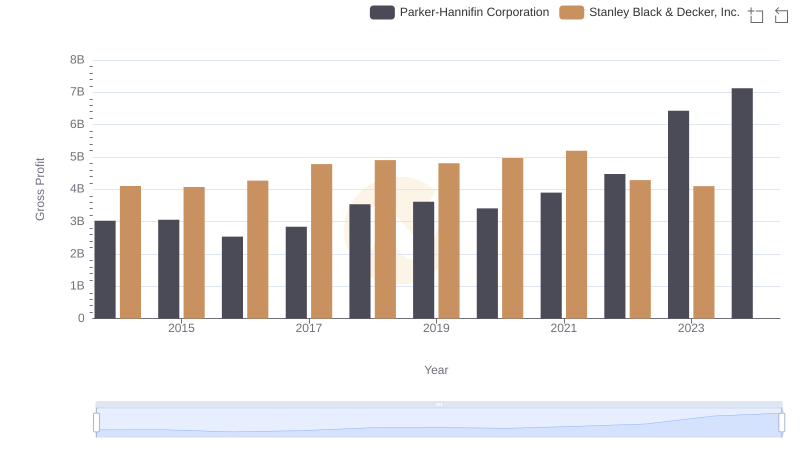
Gross Profit Comparison: Parker-Hannifin Corporation and Stanley Black & Decker, Inc. Trends
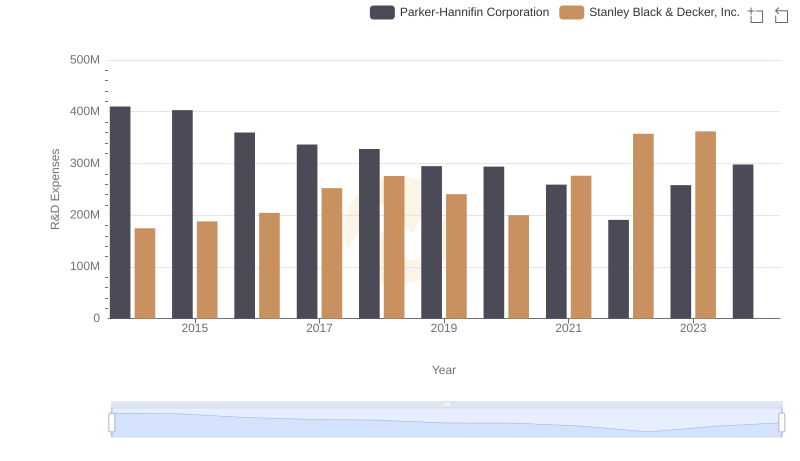
Parker-Hannifin Corporation or Stanley Black & Decker, Inc.: Who Invests More in Innovation?

Parker-Hannifin Corporation vs Stanley Black & Decker, Inc.: In-Depth EBITDA Performance Comparison