| __timestamp | Parker-Hannifin Corporation | Stanley Black & Decker, Inc. |
|---|---|---|
| Wednesday, January 1, 2014 | 10188227000 | 7235900000 |
| Thursday, January 1, 2015 | 9655245000 | 7099800000 |
| Friday, January 1, 2016 | 8823384000 | 7139700000 |
| Sunday, January 1, 2017 | 9188962000 | 7969200000 |
| Monday, January 1, 2018 | 10762841000 | 9080500000 |
| Tuesday, January 1, 2019 | 10703484000 | 9636700000 |
| Wednesday, January 1, 2020 | 10286518000 | 9566700000 |
| Friday, January 1, 2021 | 10449680000 | 10423000000 |
| Saturday, January 1, 2022 | 11387267000 | 12663300000 |
| Sunday, January 1, 2023 | 12635892000 | 11683100000 |
| Monday, January 1, 2024 | 12801816000 | 10851300000 |
Unleashing the power of data
In the ever-evolving landscape of industrial manufacturing, Parker-Hannifin Corporation and Stanley Black & Decker, Inc. stand as titans. From 2014 to 2023, these companies have showcased intriguing trends in their cost of revenue. Parker-Hannifin's cost of revenue has seen a steady climb, peaking in 2023 with a 24% increase from its 2014 figures. Meanwhile, Stanley Black & Decker experienced a significant surge, with a 75% rise from 2014 to 2022, before a slight dip in 2023. This data highlights the dynamic nature of the industry, where strategic decisions and market conditions play pivotal roles. Notably, the absence of data for Stanley Black & Decker in 2024 leaves room for speculation on future trends. As these companies navigate the complexities of global markets, their financial strategies will continue to be a focal point for industry analysts and investors alike.
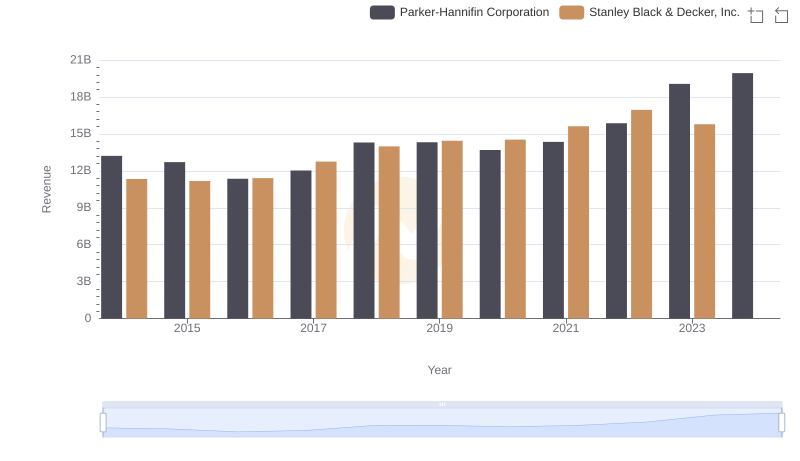
Parker-Hannifin Corporation and Stanley Black & Decker, Inc.: A Comprehensive Revenue Analysis

Cost of Revenue Trends: Parker-Hannifin Corporation vs Stanley Black & Decker, Inc.

Parker-Hannifin Corporation and Stanley Black & Decker, Inc.: A Detailed Gross Profit Analysis

Research and Development Expenses Breakdown: Parker-Hannifin Corporation vs Stanley Black & Decker, Inc.
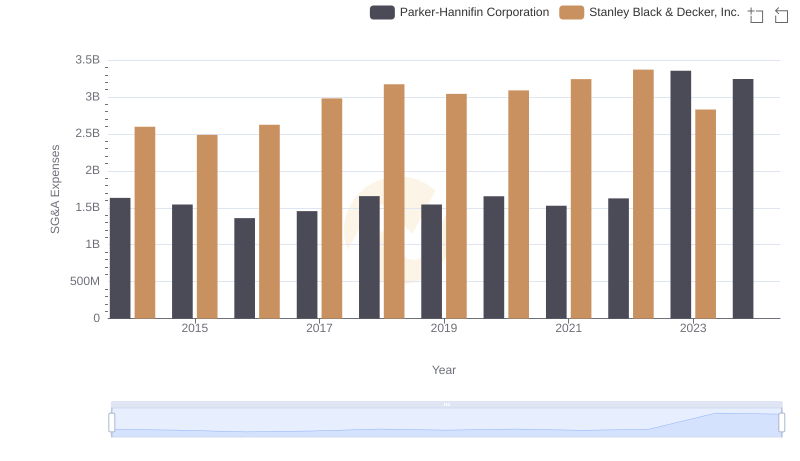
Operational Costs Compared: SG&A Analysis of Parker-Hannifin Corporation and Stanley Black & Decker, Inc.
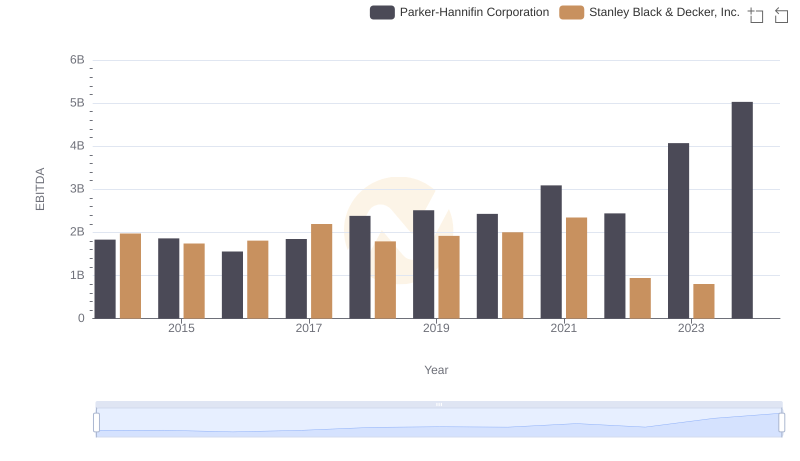
Comparative EBITDA Analysis: Parker-Hannifin Corporation vs Stanley Black & Decker, Inc.

Parker-Hannifin Corporation and Stanley Black & Decker, Inc.: A Comprehensive Revenue Analysis
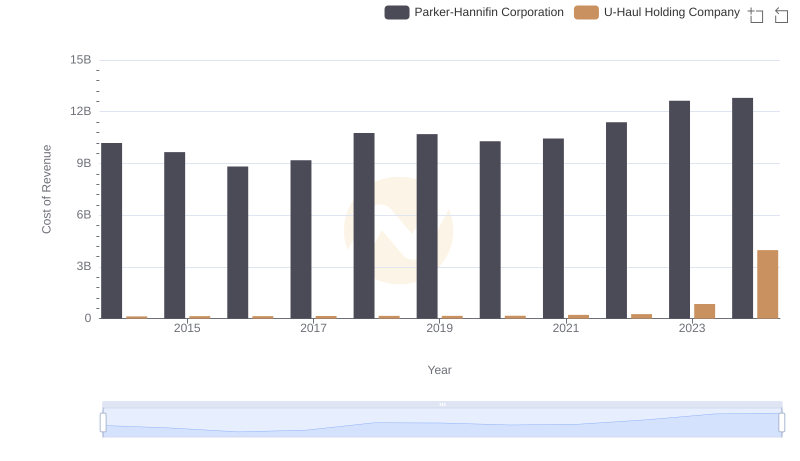
Cost Insights: Breaking Down Parker-Hannifin Corporation and U-Haul Holding Company's Expenses
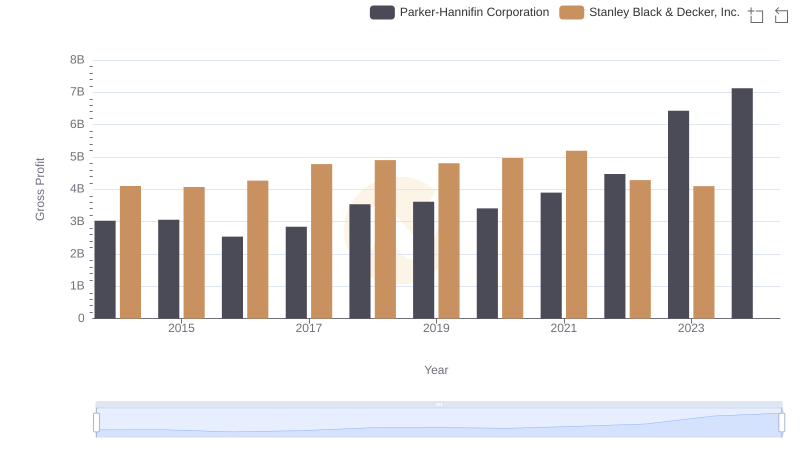
Gross Profit Comparison: Parker-Hannifin Corporation and Stanley Black & Decker, Inc. Trends
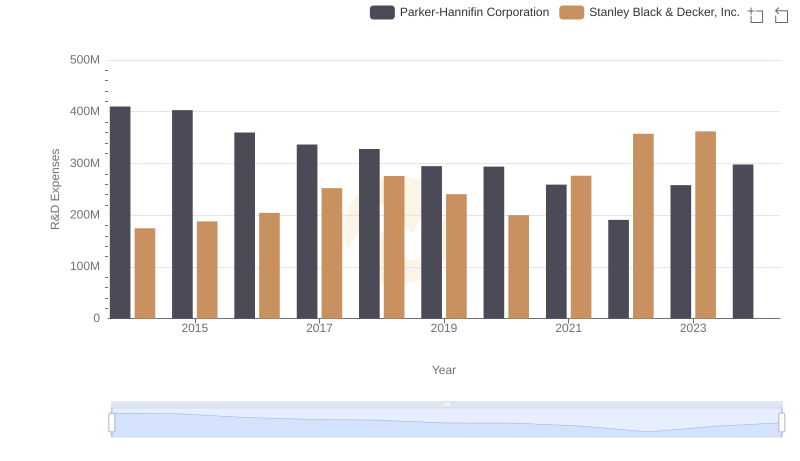
Parker-Hannifin Corporation or Stanley Black & Decker, Inc.: Who Invests More in Innovation?

Parker-Hannifin Corporation vs Stanley Black & Decker, Inc.: In-Depth EBITDA Performance Comparison