| __timestamp | Owens Corning | Parker-Hannifin Corporation |
|---|---|---|
| Wednesday, January 1, 2014 | 4300000000 | 10188227000 |
| Thursday, January 1, 2015 | 4197000000 | 9655245000 |
| Friday, January 1, 2016 | 4296000000 | 8823384000 |
| Sunday, January 1, 2017 | 4812000000 | 9188962000 |
| Monday, January 1, 2018 | 5425000000 | 10762841000 |
| Tuesday, January 1, 2019 | 5551000000 | 10703484000 |
| Wednesday, January 1, 2020 | 5445000000 | 10286518000 |
| Friday, January 1, 2021 | 6281000000 | 10449680000 |
| Saturday, January 1, 2022 | 7145000000 | 11387267000 |
| Sunday, January 1, 2023 | 6994000000 | 12635892000 |
| Monday, January 1, 2024 | 12801816000 |
Infusing magic into the data realm
In the competitive landscape of industrial manufacturing, cost efficiency is a critical metric. This analysis delves into the cost of revenue trends for Parker-Hannifin Corporation and Owens Corning from 2014 to 2023. Parker-Hannifin, a leader in motion and control technologies, consistently outpaces Owens Corning, a global building and industrial materials leader, in terms of cost of revenue.
Parker-Hannifin's Dominance: Over the past decade, Parker-Hannifin's cost of revenue has averaged around 10.6 billion, nearly double that of Owens Corning, which averages 5.4 billion. This indicates a larger scale of operations and possibly higher efficiency in managing costs relative to revenue.
Growth Trends: Both companies have shown growth, with Parker-Hannifin's cost of revenue increasing by approximately 24% from 2014 to 2023, while Owens Corning saw a 63% rise in the same period.
Missing Data: Notably, Owens Corning's data for 2024 is missing, which could impact future trend analysis.
This comparison highlights the strategic financial management and operational scale of these industrial giants, offering valuable insights for investors and industry analysts.
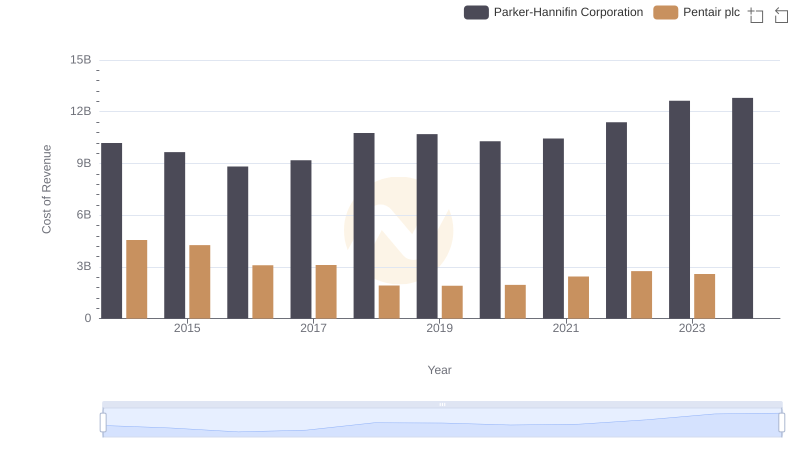
Cost Insights: Breaking Down Parker-Hannifin Corporation and Pentair plc's Expenses
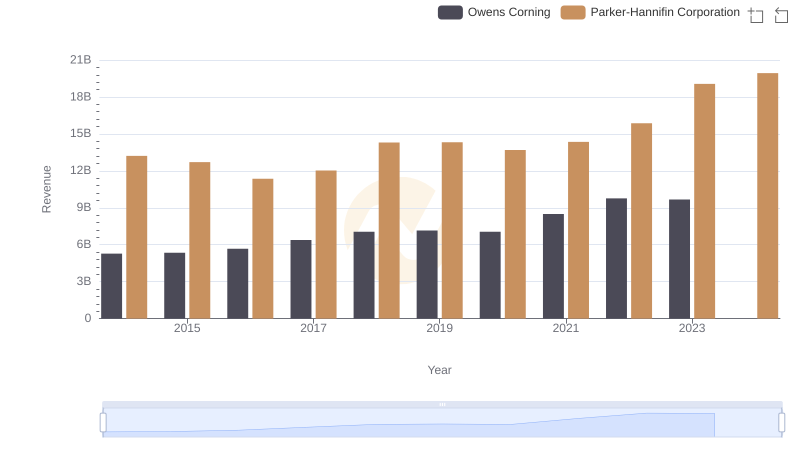
Comparing Revenue Performance: Parker-Hannifin Corporation or Owens Corning?
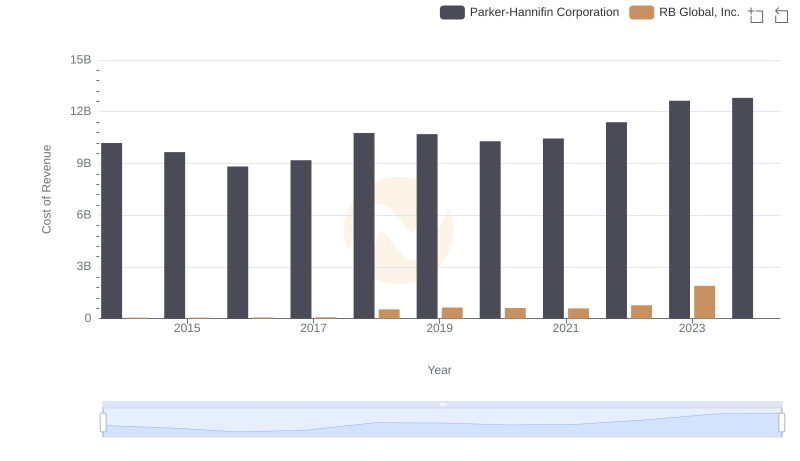
Cost Insights: Breaking Down Parker-Hannifin Corporation and RB Global, Inc.'s Expenses
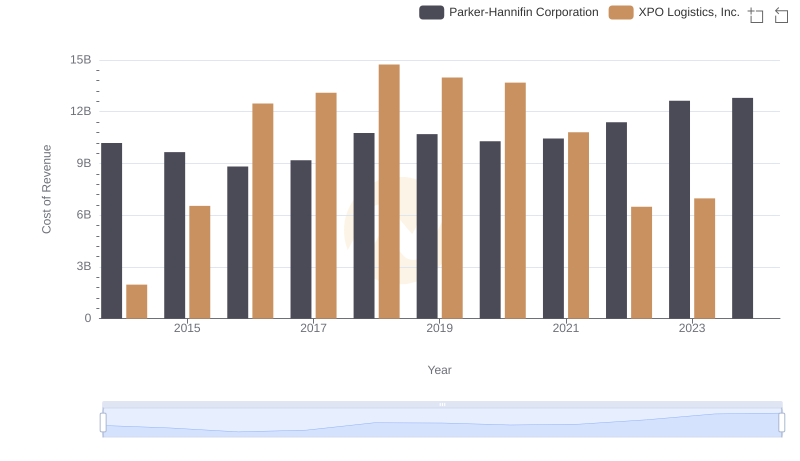
Cost of Revenue Comparison: Parker-Hannifin Corporation vs XPO Logistics, Inc.
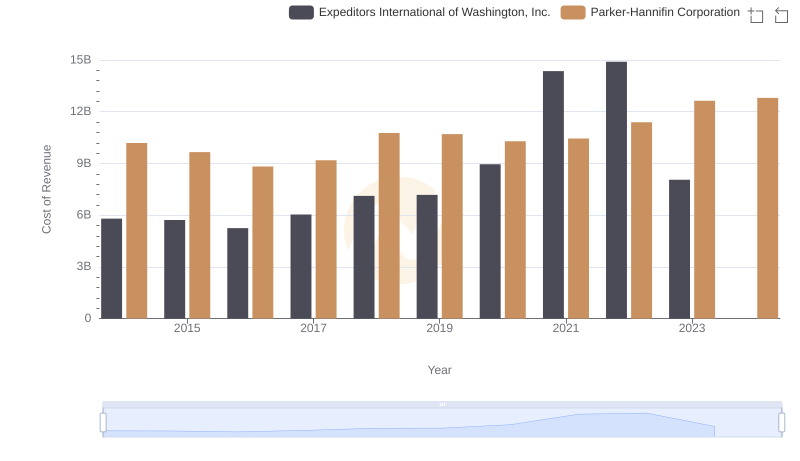
Cost of Revenue: Key Insights for Parker-Hannifin Corporation and Expeditors International of Washington, Inc.
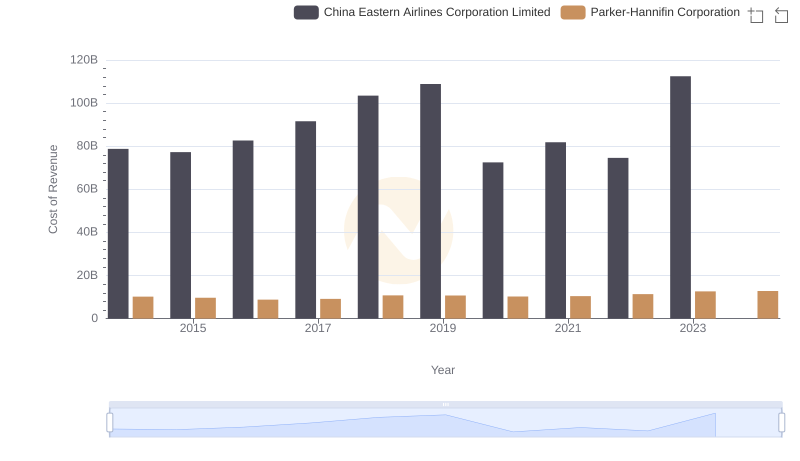
Cost of Revenue Trends: Parker-Hannifin Corporation vs China Eastern Airlines Corporation Limited
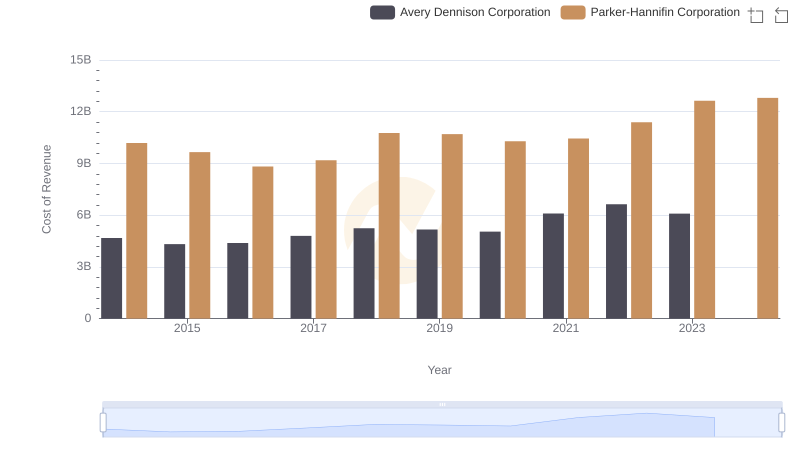
Cost of Revenue Trends: Parker-Hannifin Corporation vs Avery Dennison Corporation
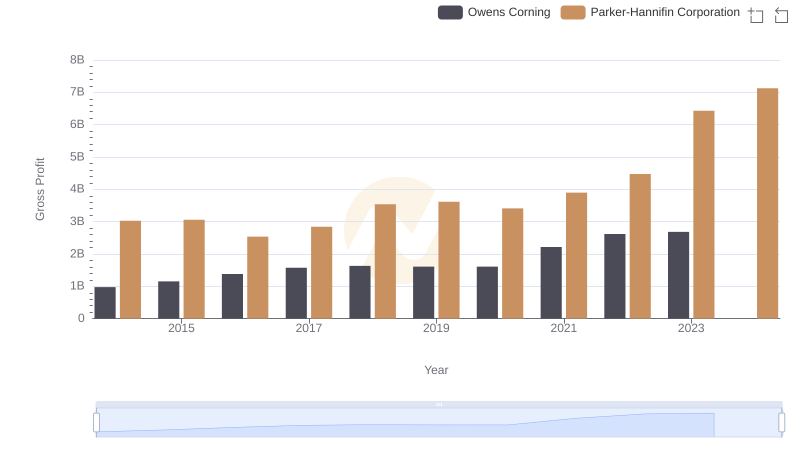
Gross Profit Trends Compared: Parker-Hannifin Corporation vs Owens Corning
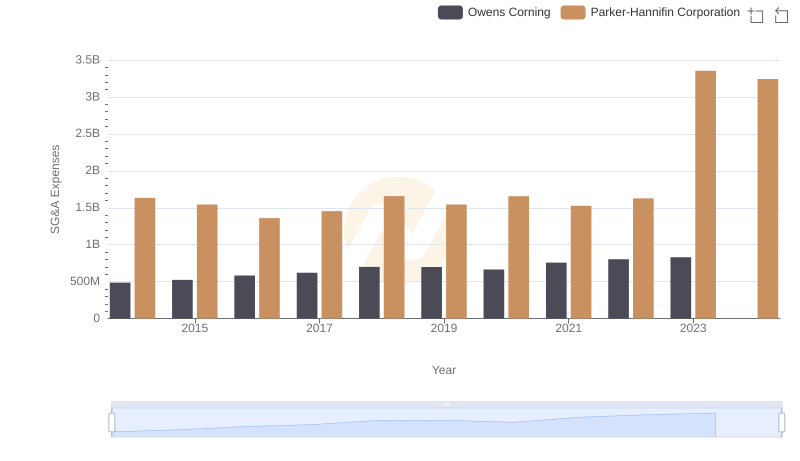
Operational Costs Compared: SG&A Analysis of Parker-Hannifin Corporation and Owens Corning
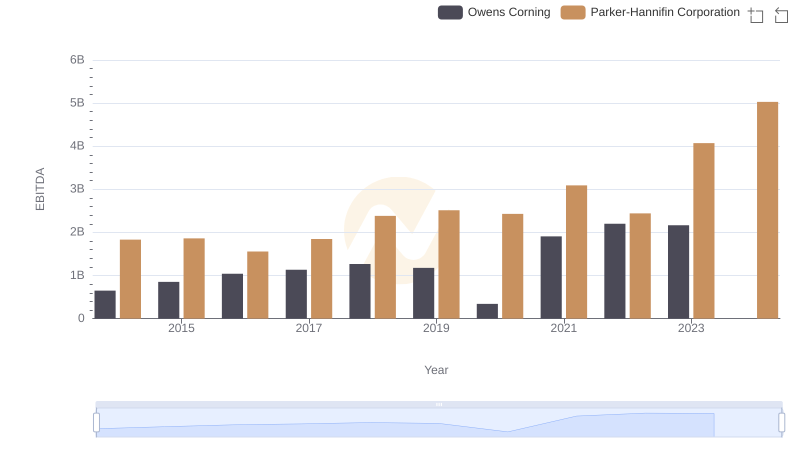
Parker-Hannifin Corporation and Owens Corning: A Detailed Examination of EBITDA Performance