| __timestamp | Parker-Hannifin Corporation | RB Global, Inc. |
|---|---|---|
| Wednesday, January 1, 2014 | 10188227000 | 57884000 |
| Thursday, January 1, 2015 | 9655245000 | 56026000 |
| Friday, January 1, 2016 | 8823384000 | 66062000 |
| Sunday, January 1, 2017 | 9188962000 | 79013000 |
| Monday, January 1, 2018 | 10762841000 | 533397000 |
| Tuesday, January 1, 2019 | 10703484000 | 645816000 |
| Wednesday, January 1, 2020 | 10286518000 | 615589000 |
| Friday, January 1, 2021 | 10449680000 | 594783000 |
| Saturday, January 1, 2022 | 11387267000 | 776701000 |
| Sunday, January 1, 2023 | 12635892000 | 1901200000 |
| Monday, January 1, 2024 | 12801816000 | 0 |
Infusing magic into the data realm
In the ever-evolving landscape of industrial manufacturing and auction services, understanding cost structures is pivotal. Parker-Hannifin Corporation, a leader in motion and control technologies, has seen its cost of revenue grow by approximately 26% from 2014 to 2023. This increase reflects the company's strategic expansions and innovations. Meanwhile, RB Global, Inc., a major player in the auction industry, experienced a staggering 3,180% rise in costs over the same period, highlighting its aggressive growth and market penetration.
This analysis underscores the dynamic nature of these industries, where strategic cost management is crucial for sustained growth.
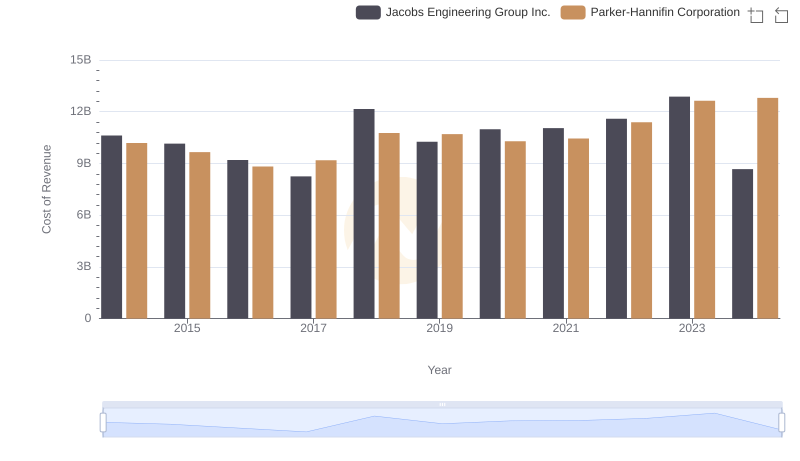
Parker-Hannifin Corporation vs Jacobs Engineering Group Inc.: Efficiency in Cost of Revenue Explored
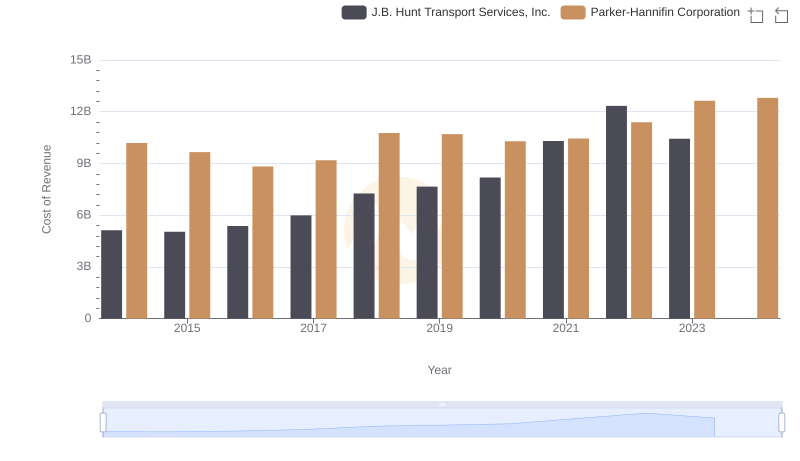
Parker-Hannifin Corporation vs J.B. Hunt Transport Services, Inc.: Efficiency in Cost of Revenue Explored
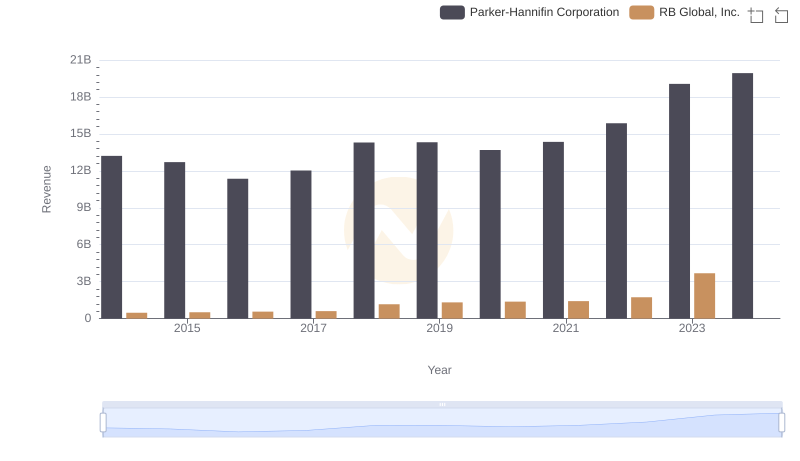
Breaking Down Revenue Trends: Parker-Hannifin Corporation vs RB Global, Inc.
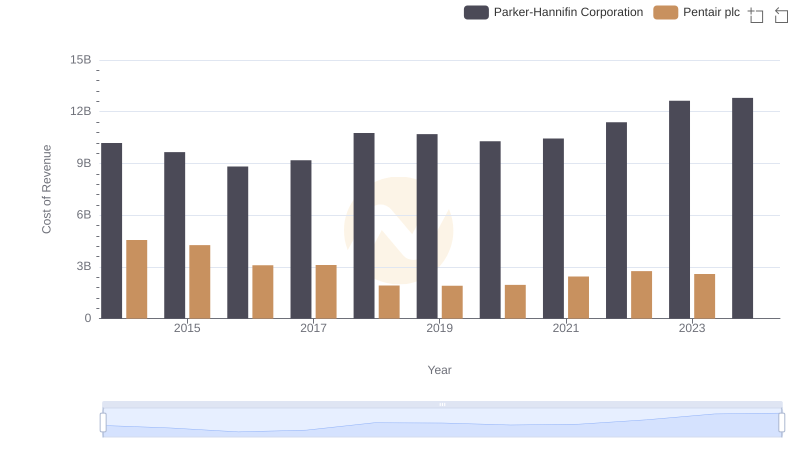
Cost Insights: Breaking Down Parker-Hannifin Corporation and Pentair plc's Expenses
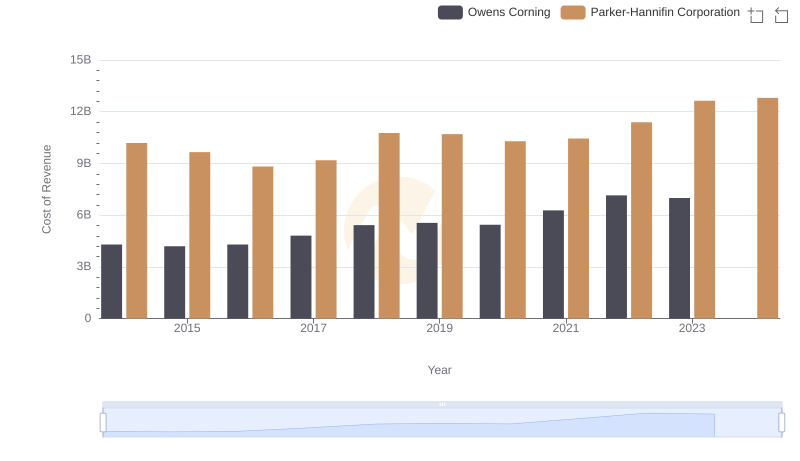
Parker-Hannifin Corporation vs Owens Corning: Efficiency in Cost of Revenue Explored
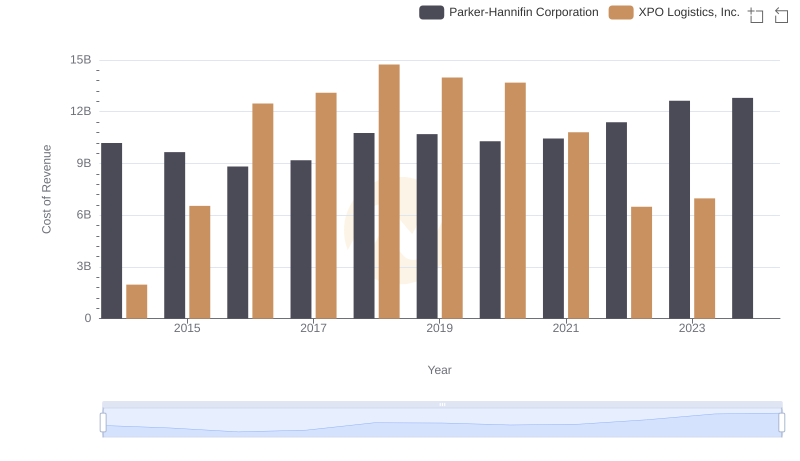
Cost of Revenue Comparison: Parker-Hannifin Corporation vs XPO Logistics, Inc.
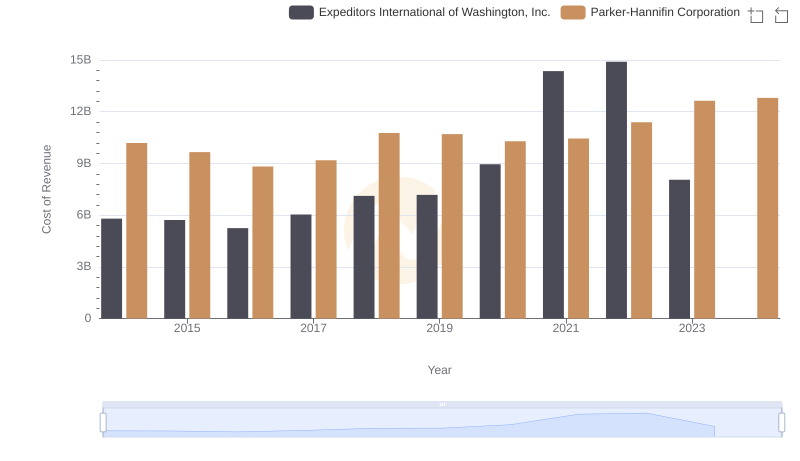
Cost of Revenue: Key Insights for Parker-Hannifin Corporation and Expeditors International of Washington, Inc.
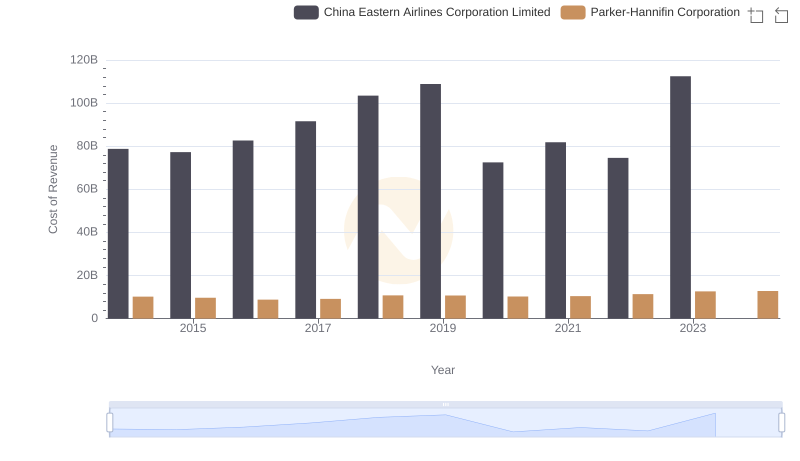
Cost of Revenue Trends: Parker-Hannifin Corporation vs China Eastern Airlines Corporation Limited
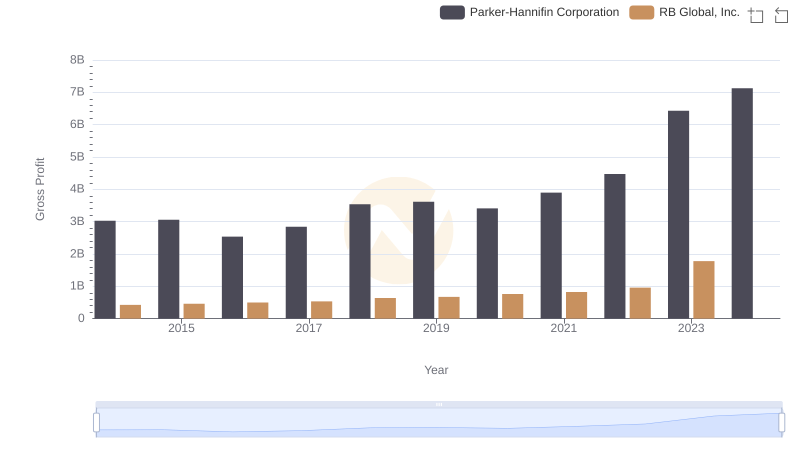
Who Generates Higher Gross Profit? Parker-Hannifin Corporation or RB Global, Inc.
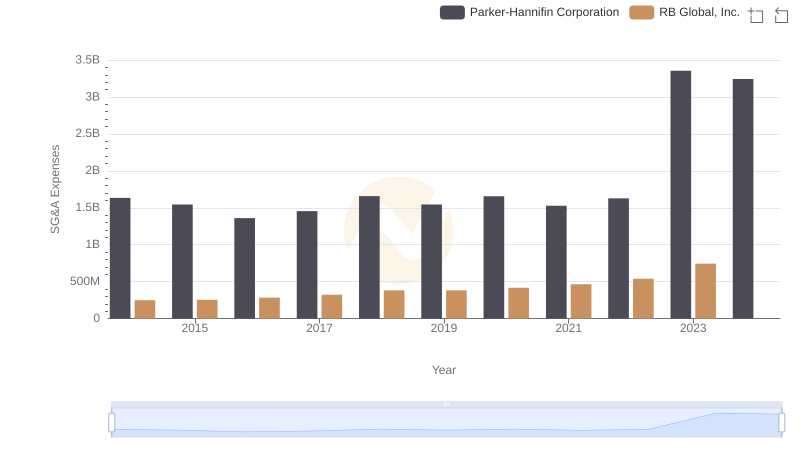
Breaking Down SG&A Expenses: Parker-Hannifin Corporation vs RB Global, Inc.