| __timestamp | Owens Corning | Parker-Hannifin Corporation |
|---|---|---|
| Wednesday, January 1, 2014 | 976000000 | 3027744000 |
| Thursday, January 1, 2015 | 1153000000 | 3056499000 |
| Friday, January 1, 2016 | 1381000000 | 2537369000 |
| Sunday, January 1, 2017 | 1572000000 | 2840350000 |
| Monday, January 1, 2018 | 1632000000 | 3539551000 |
| Tuesday, January 1, 2019 | 1609000000 | 3616840000 |
| Wednesday, January 1, 2020 | 1610000000 | 3409002000 |
| Friday, January 1, 2021 | 2217000000 | 3897960000 |
| Saturday, January 1, 2022 | 2616000000 | 4474341000 |
| Sunday, January 1, 2023 | 2683000000 | 6429302000 |
| Monday, January 1, 2024 | 7127790000 |
Cracking the code
In the competitive landscape of industrial manufacturing, Parker-Hannifin Corporation and Owens Corning have showcased distinct trajectories in their gross profit trends over the past decade. From 2014 to 2023, Parker-Hannifin's gross profit surged by approximately 112%, peaking at an impressive $6.43 billion in 2023. This growth reflects the company's strategic expansions and innovations in motion and control technologies.
Conversely, Owens Corning, a leader in building materials, experienced a steady rise in gross profit, with a notable 175% increase from 2014 to 2023, reaching $2.68 billion. This growth underscores the company's resilience and adaptability in the face of market fluctuations.
While Parker-Hannifin's profits soared, Owens Corning's consistent growth highlights its robust market position. The data for 2024 remains incomplete, leaving room for speculation on future trends.
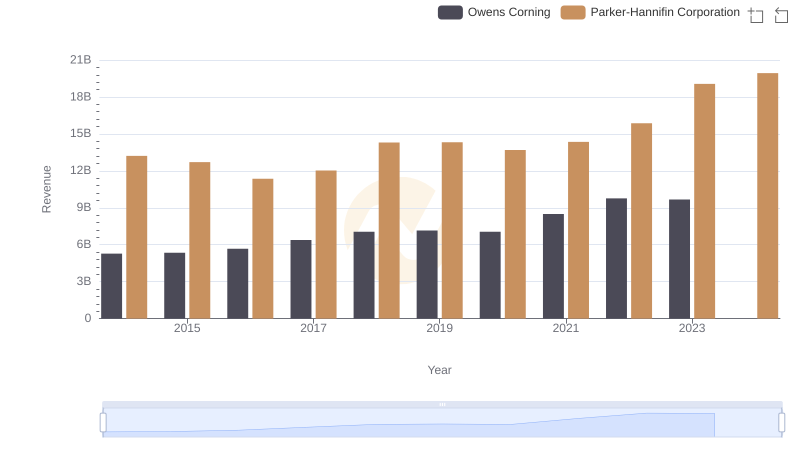
Comparing Revenue Performance: Parker-Hannifin Corporation or Owens Corning?
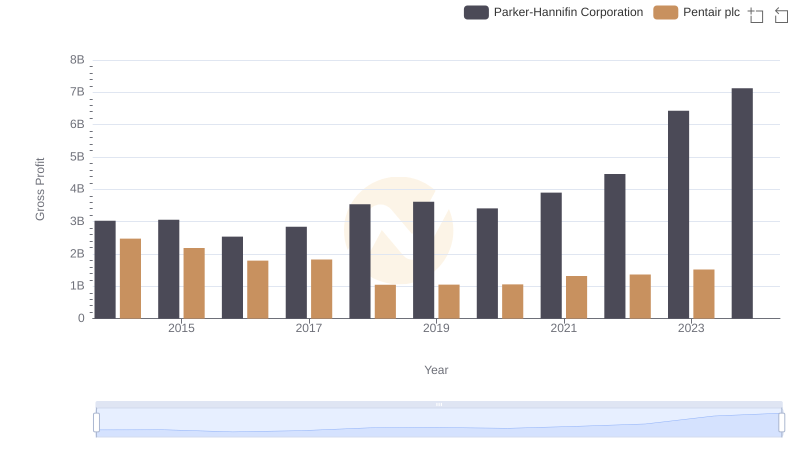
Parker-Hannifin Corporation vs Pentair plc: A Gross Profit Performance Breakdown
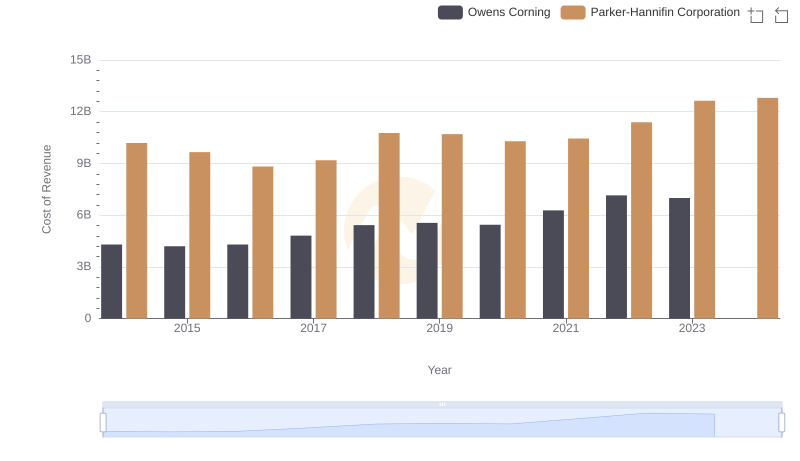
Parker-Hannifin Corporation vs Owens Corning: Efficiency in Cost of Revenue Explored
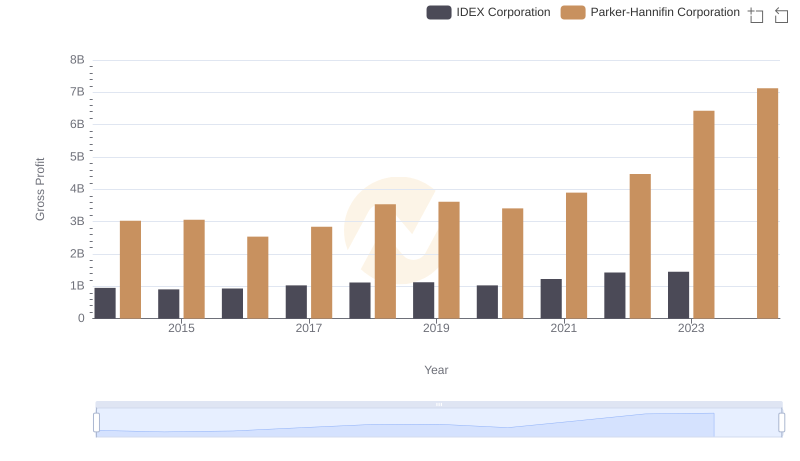
Gross Profit Analysis: Comparing Parker-Hannifin Corporation and IDEX Corporation
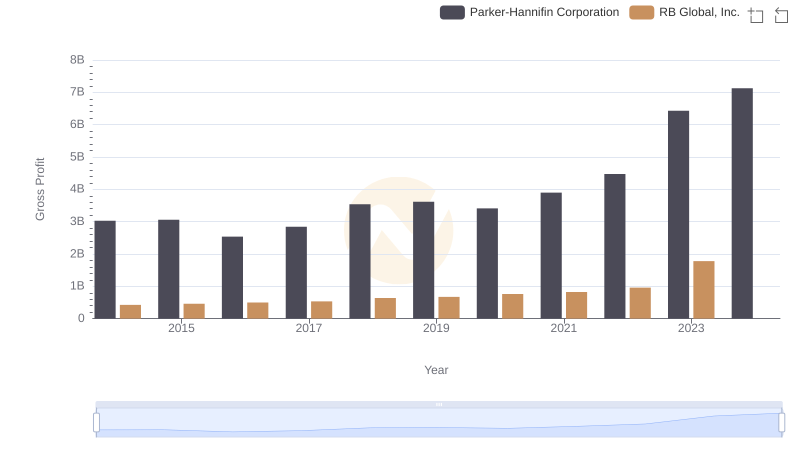
Who Generates Higher Gross Profit? Parker-Hannifin Corporation or RB Global, Inc.
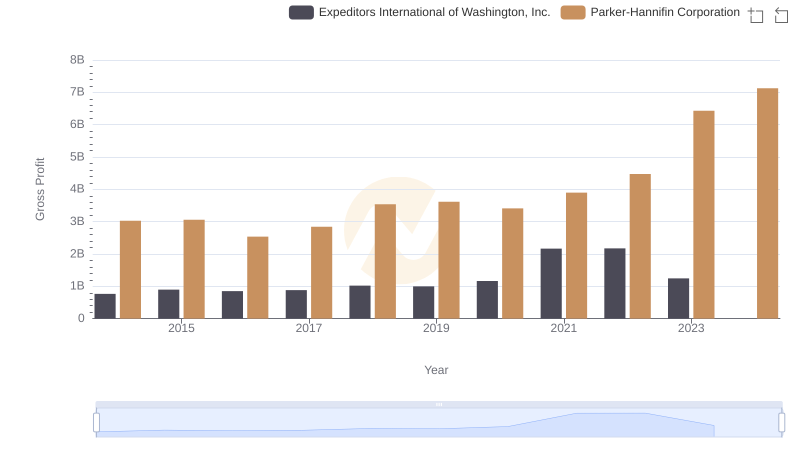
Gross Profit Trends Compared: Parker-Hannifin Corporation vs Expeditors International of Washington, Inc.
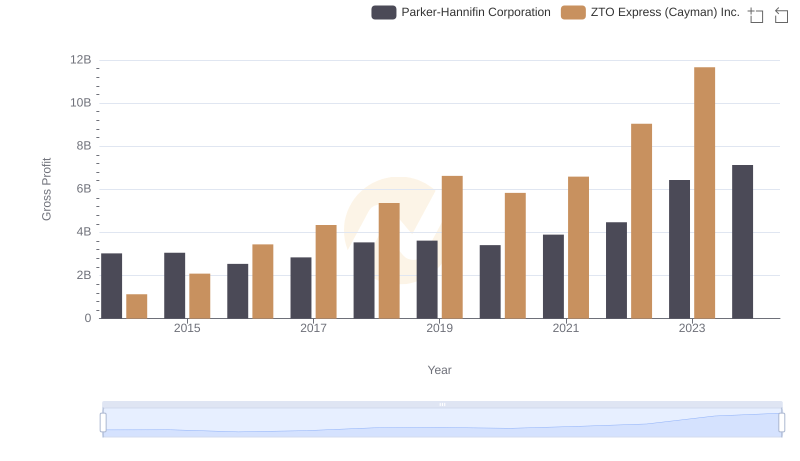
Who Generates Higher Gross Profit? Parker-Hannifin Corporation or ZTO Express (Cayman) Inc.
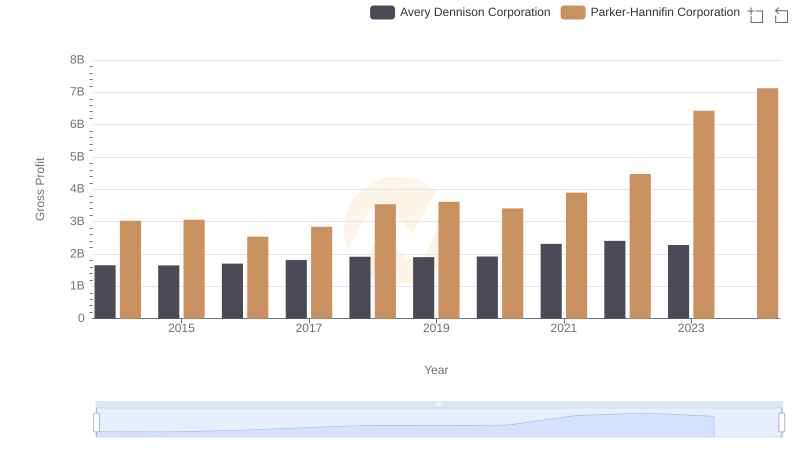
Gross Profit Comparison: Parker-Hannifin Corporation and Avery Dennison Corporation Trends
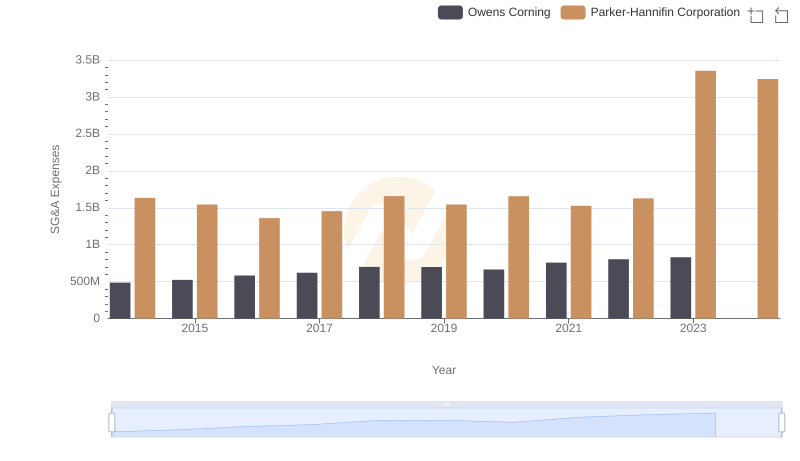
Operational Costs Compared: SG&A Analysis of Parker-Hannifin Corporation and Owens Corning
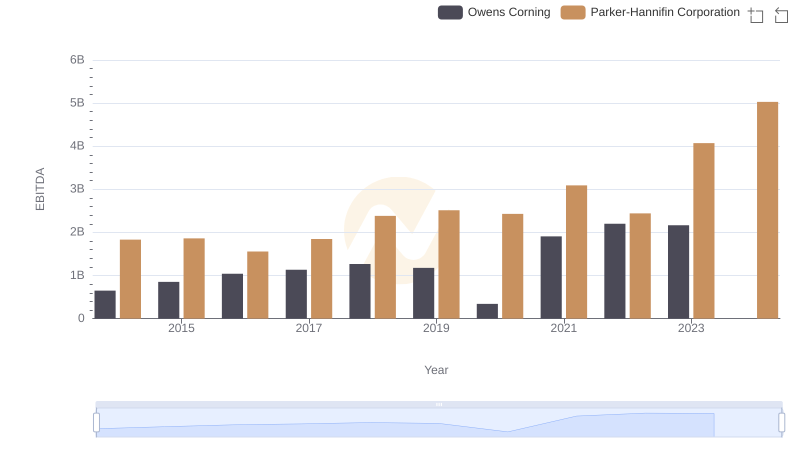
Parker-Hannifin Corporation and Owens Corning: A Detailed Examination of EBITDA Performance