| __timestamp | Owens Corning | Parker-Hannifin Corporation |
|---|---|---|
| Wednesday, January 1, 2014 | 487000000 | 1633992000 |
| Thursday, January 1, 2015 | 525000000 | 1544746000 |
| Friday, January 1, 2016 | 584000000 | 1359360000 |
| Sunday, January 1, 2017 | 620000000 | 1453935000 |
| Monday, January 1, 2018 | 700000000 | 1657152000 |
| Tuesday, January 1, 2019 | 698000000 | 1543939000 |
| Wednesday, January 1, 2020 | 664000000 | 1656553000 |
| Friday, January 1, 2021 | 757000000 | 1527302000 |
| Saturday, January 1, 2022 | 803000000 | 1627116000 |
| Sunday, January 1, 2023 | 831000000 | 3354103000 |
| Monday, January 1, 2024 | 3315177000 |
Unleashing the power of data
In the ever-evolving landscape of industrial giants, Parker-Hannifin Corporation and Owens Corning have showcased intriguing trends in their Selling, General, and Administrative (SG&A) expenses over the past decade. From 2014 to 2023, Parker-Hannifin's SG&A expenses have surged by over 100%, peaking in 2023 with a remarkable 3.35 billion dollars. This represents a significant increase, highlighting their expansive operational strategies. In contrast, Owens Corning has maintained a more stable trajectory, with a 70% increase in SG&A expenses, reaching 831 million dollars in 2023. This stability reflects a more conservative approach to operational costs. Notably, the data for 2024 is incomplete, leaving room for speculation on future trends. As these companies navigate the complexities of the global market, their SG&A expenses offer a window into their strategic priorities and financial health.
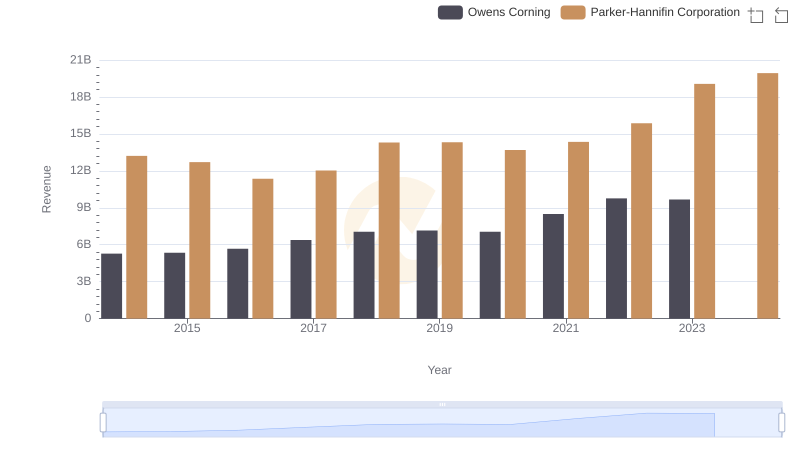
Comparing Revenue Performance: Parker-Hannifin Corporation or Owens Corning?
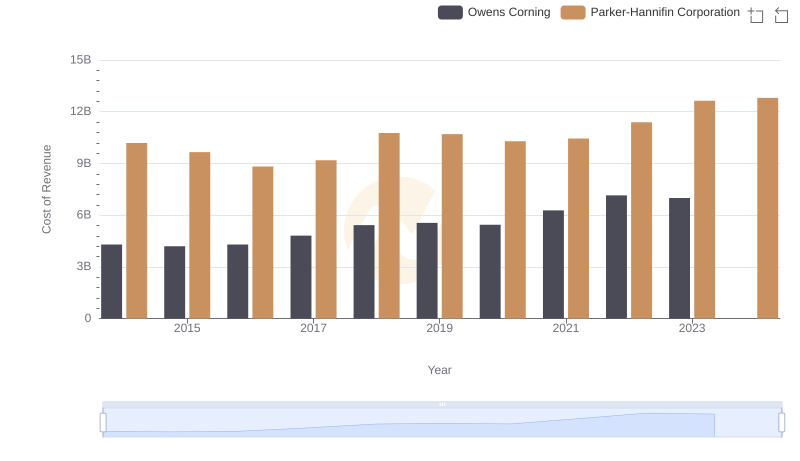
Parker-Hannifin Corporation vs Owens Corning: Efficiency in Cost of Revenue Explored
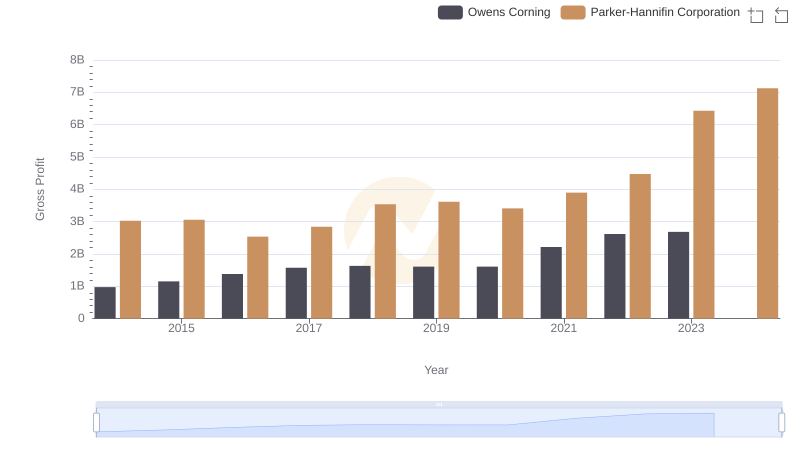
Gross Profit Trends Compared: Parker-Hannifin Corporation vs Owens Corning
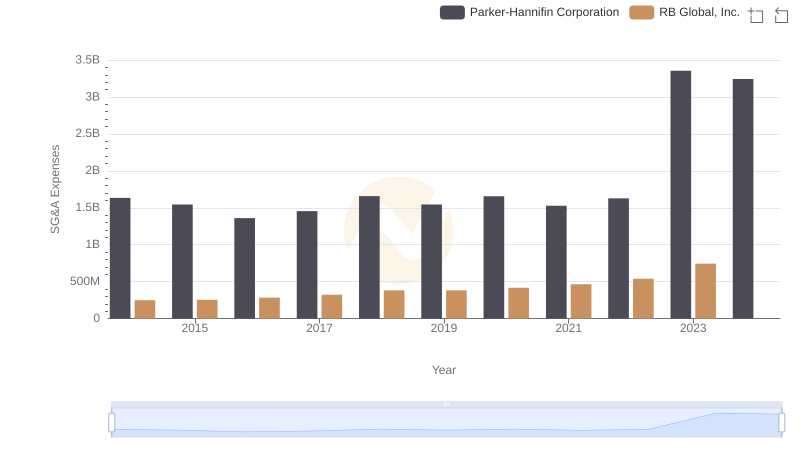
Breaking Down SG&A Expenses: Parker-Hannifin Corporation vs RB Global, Inc.
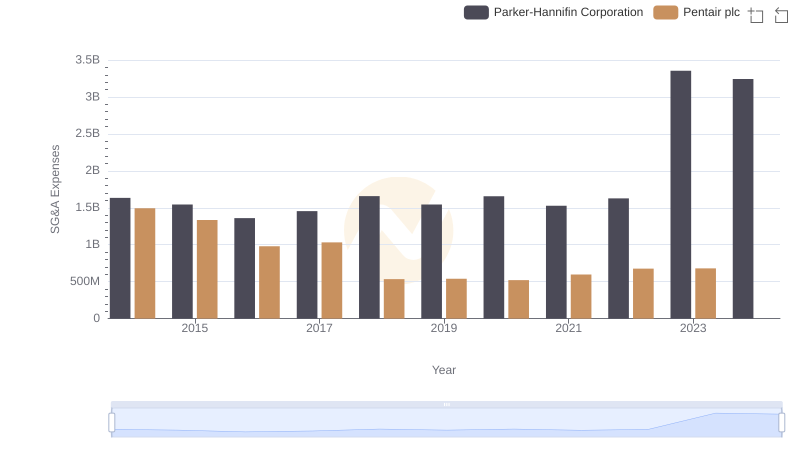
Who Optimizes SG&A Costs Better? Parker-Hannifin Corporation or Pentair plc
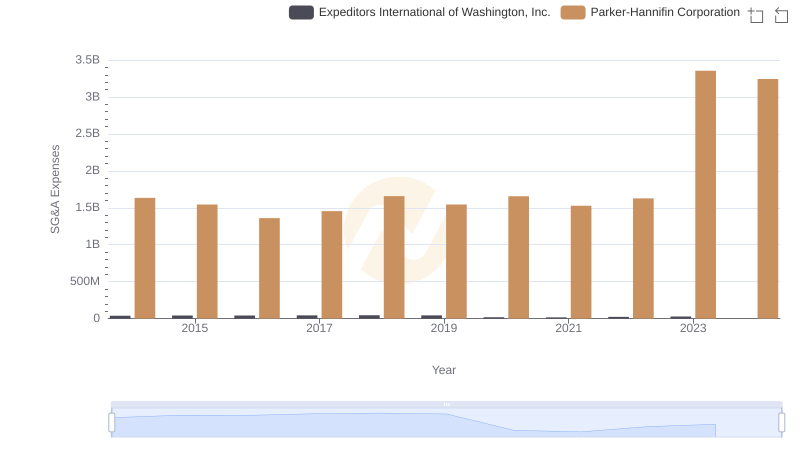
Who Optimizes SG&A Costs Better? Parker-Hannifin Corporation or Expeditors International of Washington, Inc.
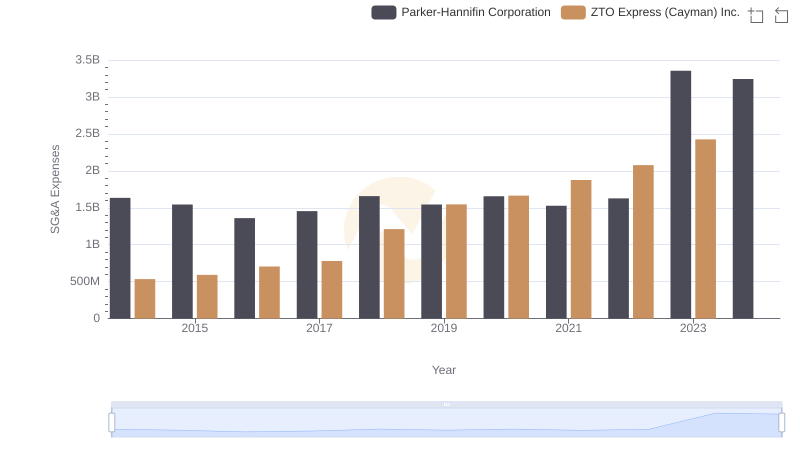
SG&A Efficiency Analysis: Comparing Parker-Hannifin Corporation and ZTO Express (Cayman) Inc.
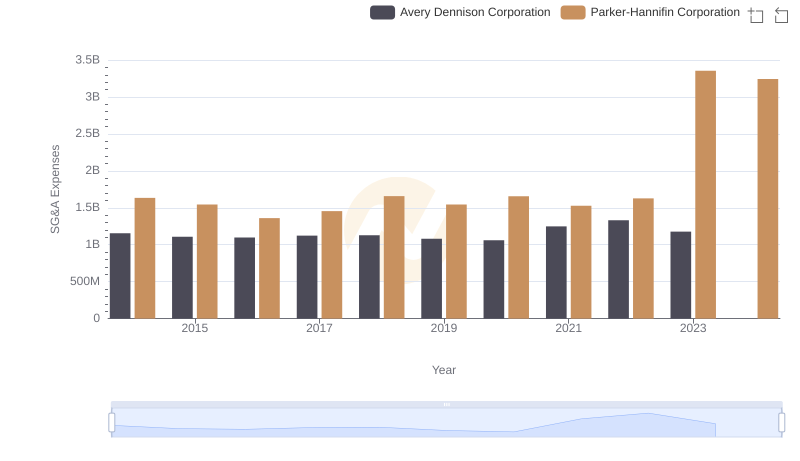
Parker-Hannifin Corporation and Avery Dennison Corporation: SG&A Spending Patterns Compared
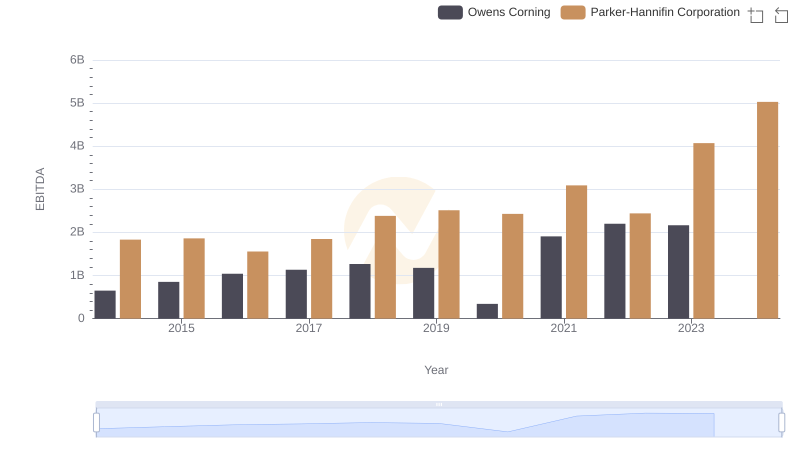
Parker-Hannifin Corporation and Owens Corning: A Detailed Examination of EBITDA Performance
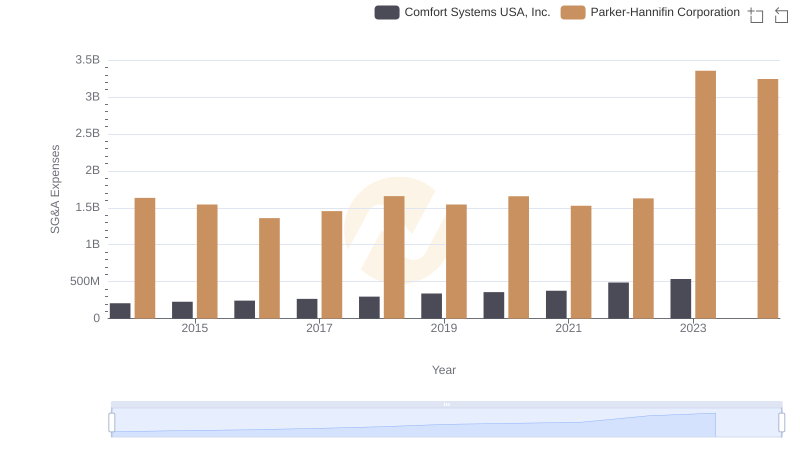
Operational Costs Compared: SG&A Analysis of Parker-Hannifin Corporation and Comfort Systems USA, Inc.