| __timestamp | Owens Corning | Parker-Hannifin Corporation |
|---|---|---|
| Wednesday, January 1, 2014 | 650000000 | 1832903000 |
| Thursday, January 1, 2015 | 853000000 | 1861551000 |
| Friday, January 1, 2016 | 1041000000 | 1558088000 |
| Sunday, January 1, 2017 | 1134000000 | 1846306000 |
| Monday, January 1, 2018 | 1266000000 | 2382235000 |
| Tuesday, January 1, 2019 | 1178000000 | 2513468000 |
| Wednesday, January 1, 2020 | 341000000 | 2431500000 |
| Friday, January 1, 2021 | 1909000000 | 3092383000 |
| Saturday, January 1, 2022 | 2200000000 | 2441242000 |
| Sunday, January 1, 2023 | 2166000000 | 4071687000 |
| Monday, January 1, 2024 | 5028229000 |
Unleashing insights
In the ever-evolving landscape of industrial giants, Parker-Hannifin Corporation and Owens Corning stand out with their impressive EBITDA trajectories over the past decade. From 2014 to 2023, Parker-Hannifin has consistently outperformed Owens Corning, showcasing a robust growth of approximately 122% in EBITDA, peaking at an impressive $4.07 billion in 2023. In contrast, Owens Corning demonstrated a steady climb, with a notable 233% increase from 2014 to 2022, reaching $2.2 billion.
The year 2020 marked a challenging period for Owens Corning, with EBITDA dipping to $341 million, reflecting the global economic downturn. However, the company rebounded strongly, achieving its highest EBITDA in 2022. Meanwhile, Parker-Hannifin's strategic initiatives have propelled its EBITDA to new heights, with a remarkable surge in 2023. As we look forward, the absence of 2024 data for Owens Corning leaves room for speculation on its future trajectory.
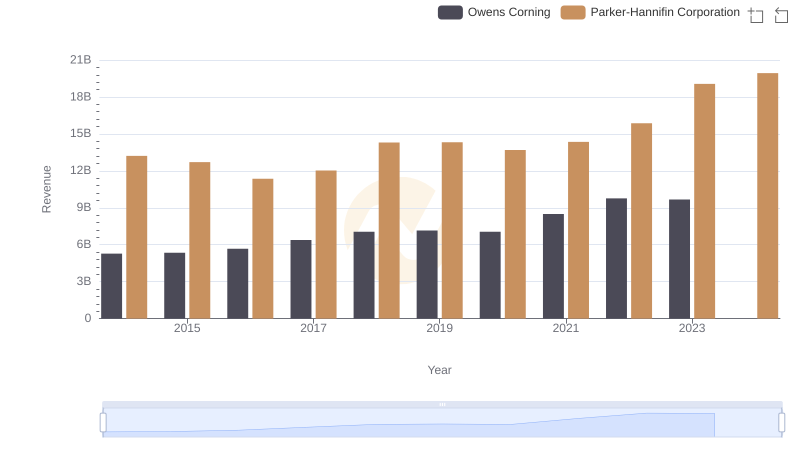
Comparing Revenue Performance: Parker-Hannifin Corporation or Owens Corning?
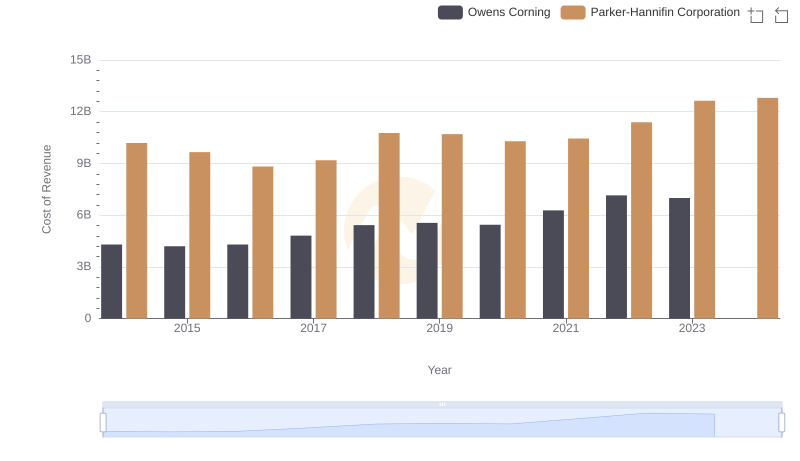
Parker-Hannifin Corporation vs Owens Corning: Efficiency in Cost of Revenue Explored
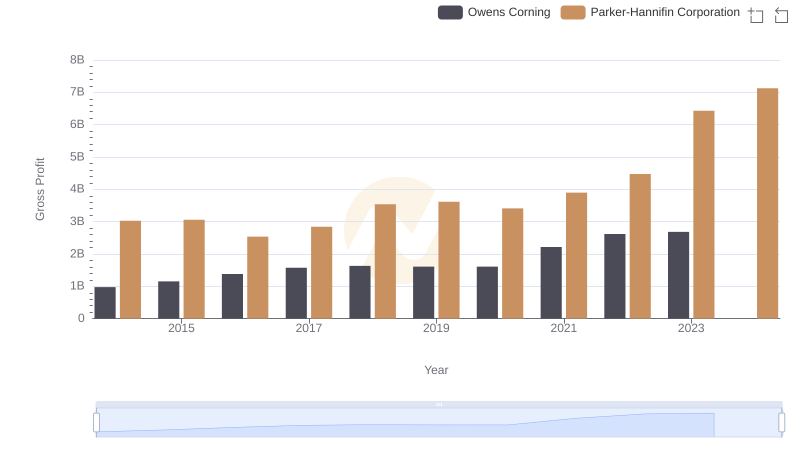
Gross Profit Trends Compared: Parker-Hannifin Corporation vs Owens Corning
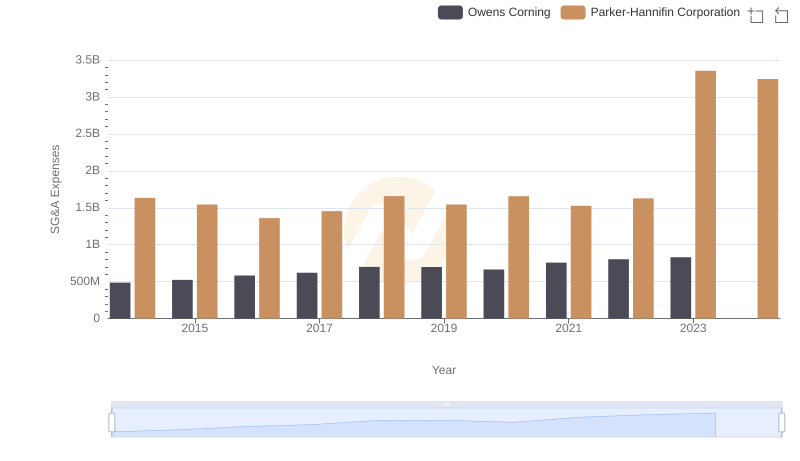
Operational Costs Compared: SG&A Analysis of Parker-Hannifin Corporation and Owens Corning
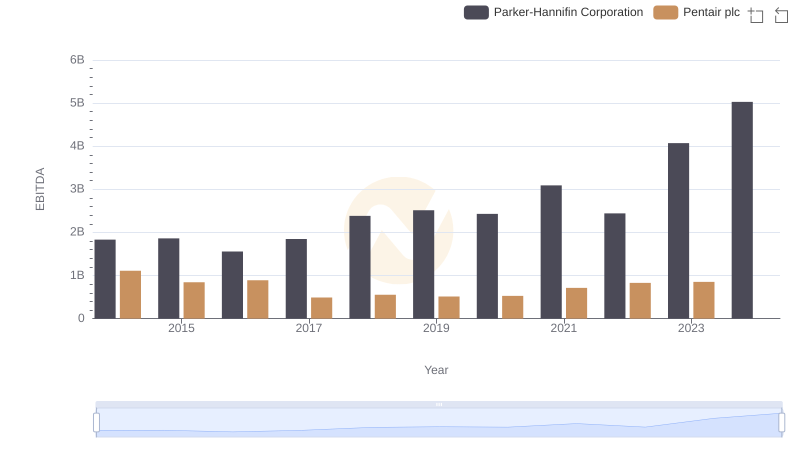
EBITDA Metrics Evaluated: Parker-Hannifin Corporation vs Pentair plc
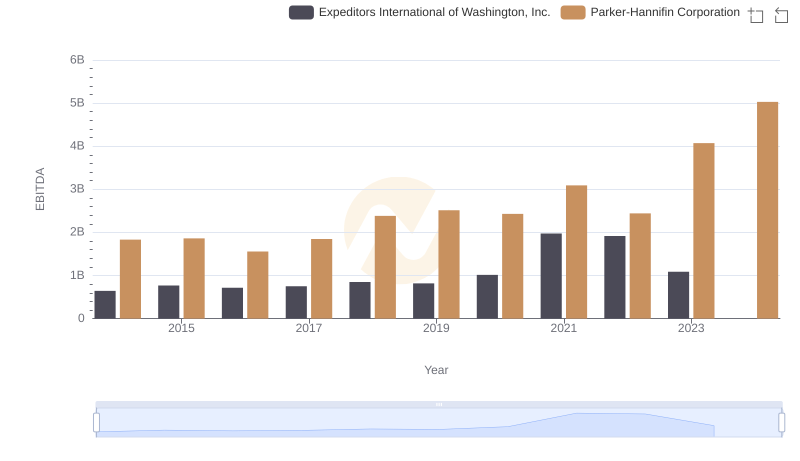
A Professional Review of EBITDA: Parker-Hannifin Corporation Compared to Expeditors International of Washington, Inc.
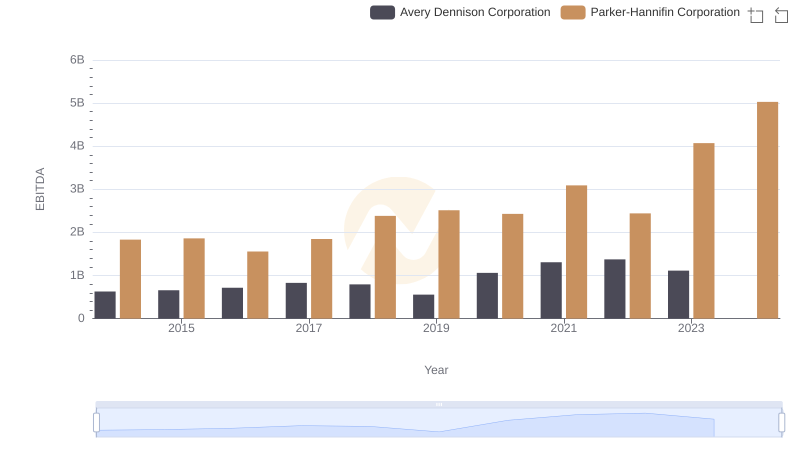
EBITDA Metrics Evaluated: Parker-Hannifin Corporation vs Avery Dennison Corporation
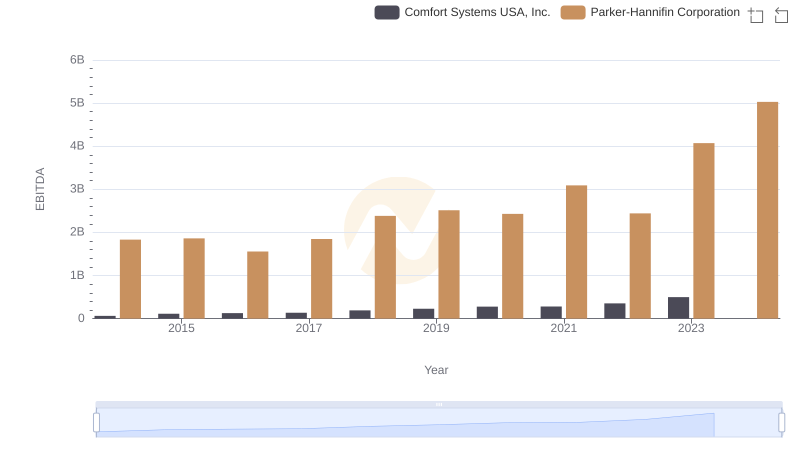
Parker-Hannifin Corporation and Comfort Systems USA, Inc.: A Detailed Examination of EBITDA Performance