| __timestamp | Parker-Hannifin Corporation | Pentair plc |
|---|---|---|
| Wednesday, January 1, 2014 | 10188227000 | 4563000000 |
| Thursday, January 1, 2015 | 9655245000 | 4263200000 |
| Friday, January 1, 2016 | 8823384000 | 3095900000 |
| Sunday, January 1, 2017 | 9188962000 | 3107400000 |
| Monday, January 1, 2018 | 10762841000 | 1917400000 |
| Tuesday, January 1, 2019 | 10703484000 | 1905700000 |
| Wednesday, January 1, 2020 | 10286518000 | 1960200000 |
| Friday, January 1, 2021 | 10449680000 | 2445600000 |
| Saturday, January 1, 2022 | 11387267000 | 2757200000 |
| Sunday, January 1, 2023 | 12635892000 | 2585300000 |
| Monday, January 1, 2024 | 12801816000 | 2484000000 |
Unlocking the unknown
In the ever-evolving landscape of industrial manufacturing, understanding cost structures is crucial. Parker-Hannifin Corporation and Pentair plc, two giants in the sector, have shown distinct trends in their cost of revenue over the past decade. From 2014 to 2023, Parker-Hannifin's cost of revenue has seen a steady increase, peaking at approximately 12.6 billion in 2023, marking a 24% rise from 2014. In contrast, Pentair plc experienced a significant drop, with costs decreasing by nearly 43% from 2014 to 2023. This divergence highlights Parker-Hannifin's expansion and Pentair's strategic cost management. Notably, data for 2024 is incomplete, indicating potential shifts in the coming year. These insights provide a window into the operational strategies of these industry leaders, offering valuable lessons in cost management and growth strategies.
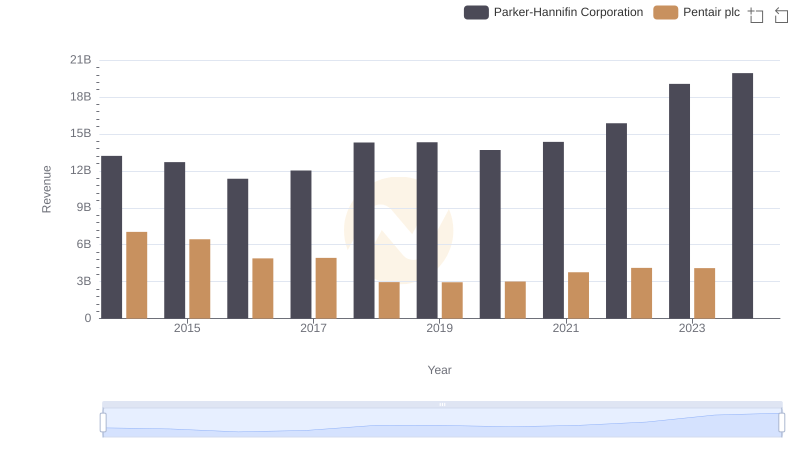
Annual Revenue Comparison: Parker-Hannifin Corporation vs Pentair plc
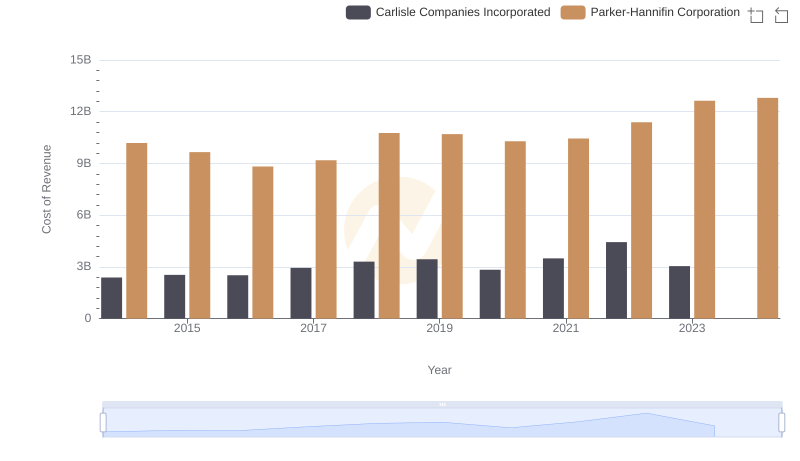
Comparing Cost of Revenue Efficiency: Parker-Hannifin Corporation vs Carlisle Companies Incorporated
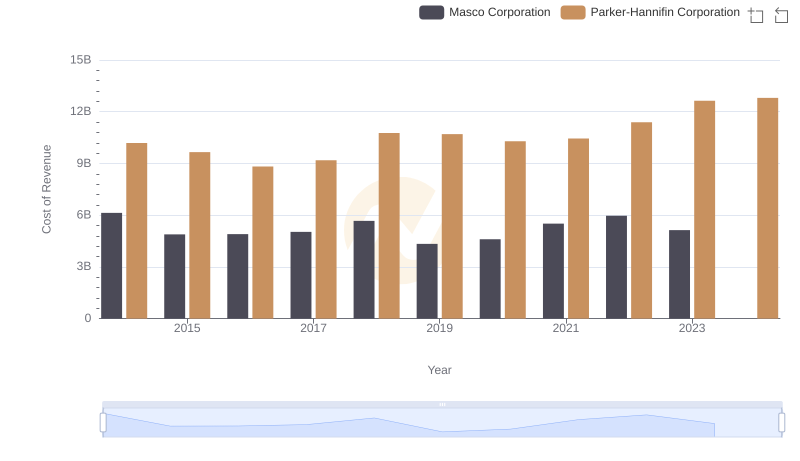
Analyzing Cost of Revenue: Parker-Hannifin Corporation and Masco Corporation
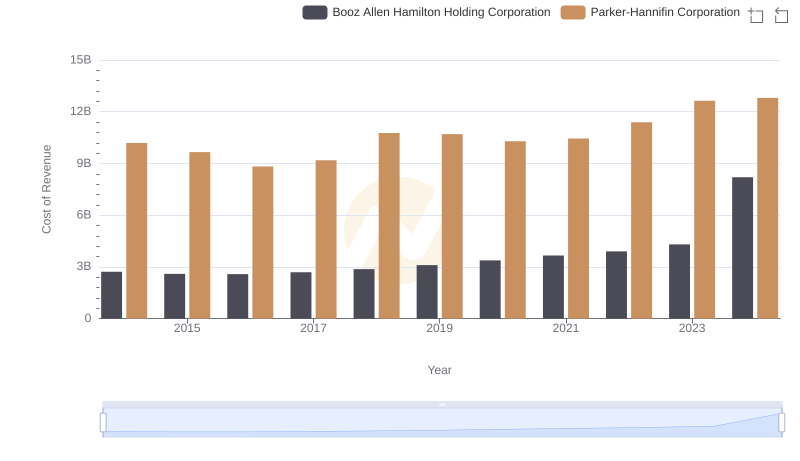
Cost Insights: Breaking Down Parker-Hannifin Corporation and Booz Allen Hamilton Holding Corporation's Expenses
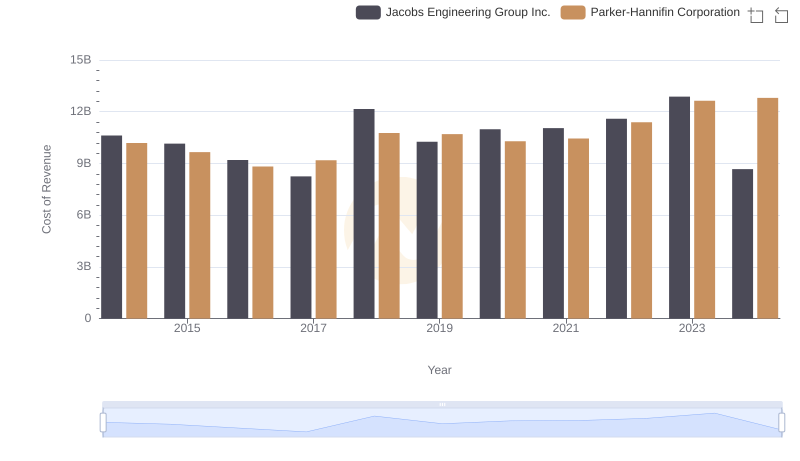
Parker-Hannifin Corporation vs Jacobs Engineering Group Inc.: Efficiency in Cost of Revenue Explored
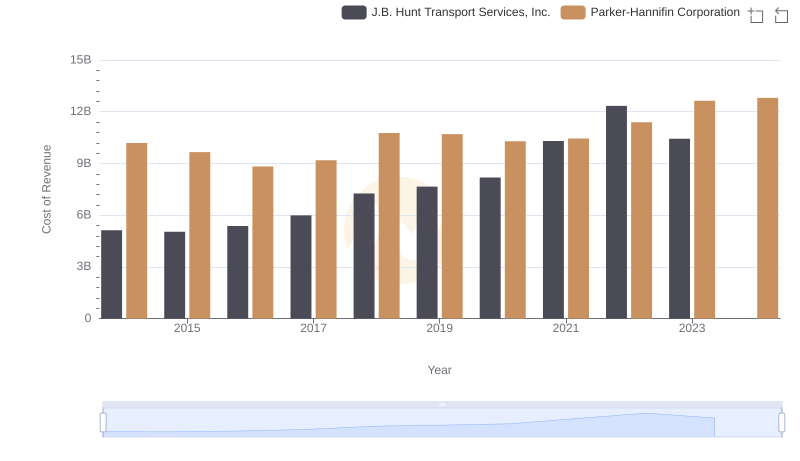
Parker-Hannifin Corporation vs J.B. Hunt Transport Services, Inc.: Efficiency in Cost of Revenue Explored
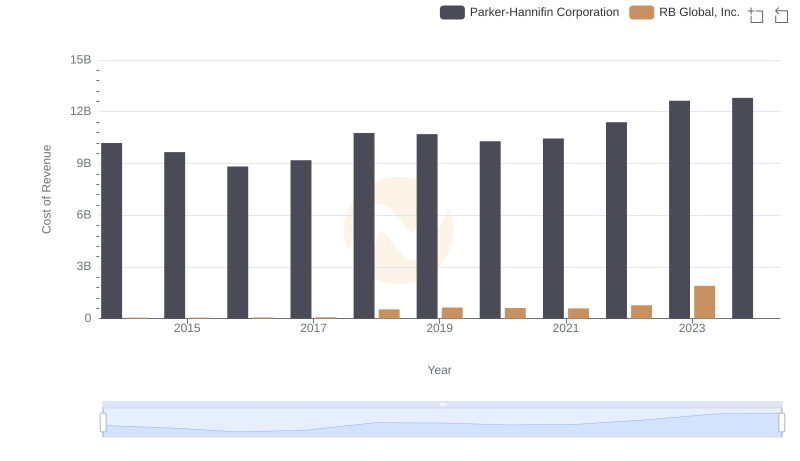
Cost Insights: Breaking Down Parker-Hannifin Corporation and RB Global, Inc.'s Expenses
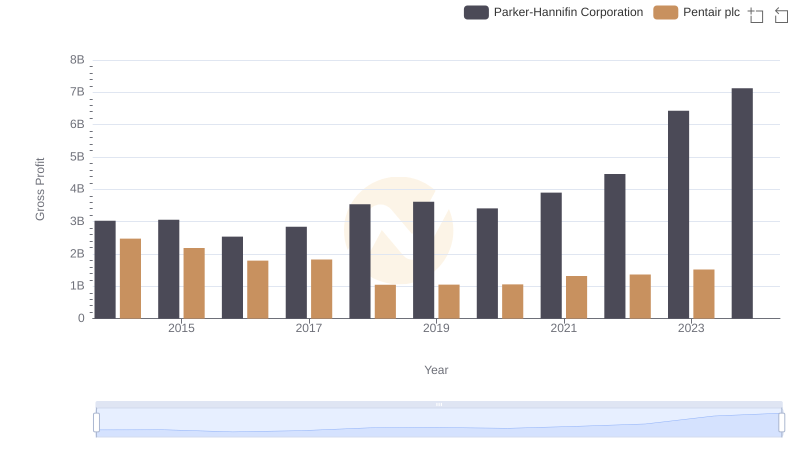
Parker-Hannifin Corporation vs Pentair plc: A Gross Profit Performance Breakdown
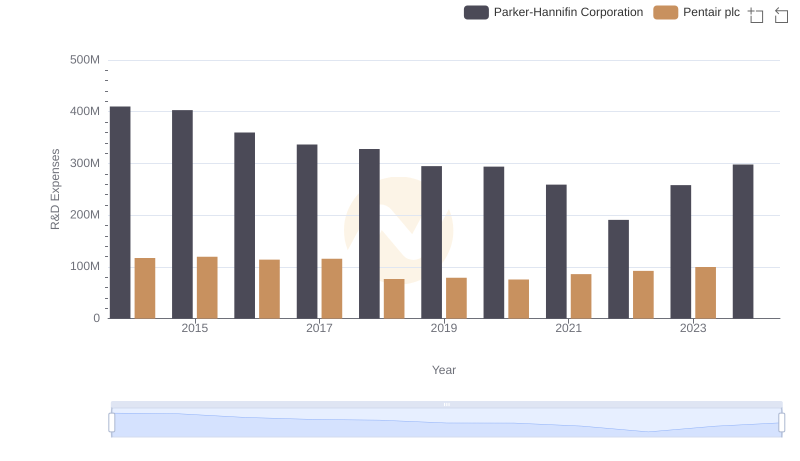
R&D Spending Showdown: Parker-Hannifin Corporation vs Pentair plc
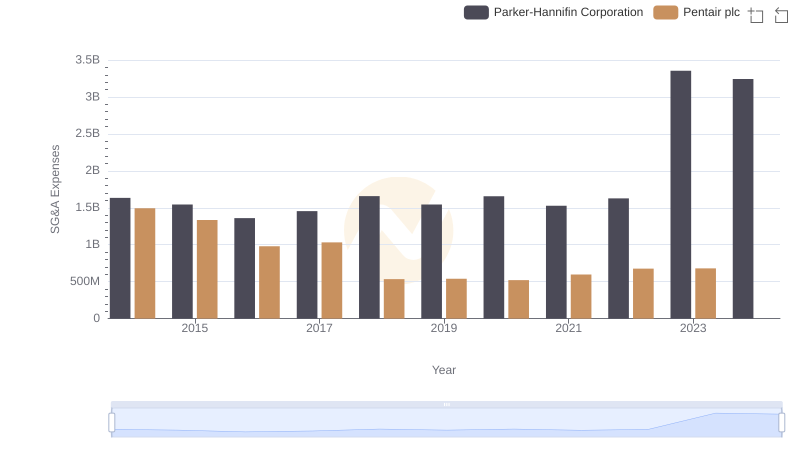
Who Optimizes SG&A Costs Better? Parker-Hannifin Corporation or Pentair plc
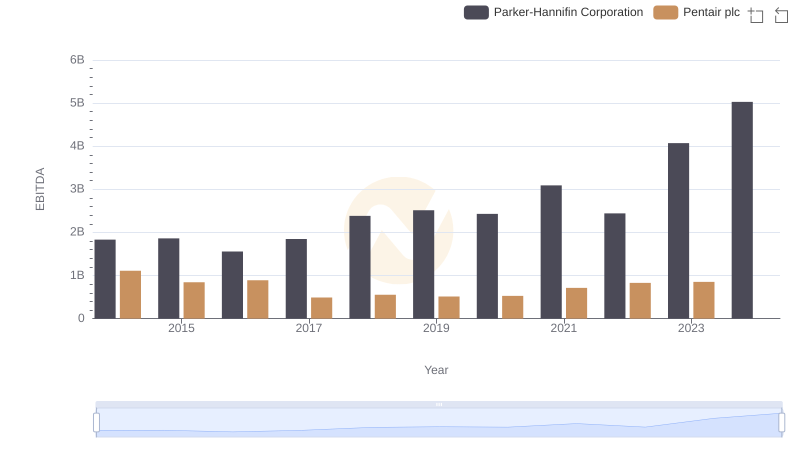
EBITDA Metrics Evaluated: Parker-Hannifin Corporation vs Pentair plc