| __timestamp | Owens Corning | Parker-Hannifin Corporation |
|---|---|---|
| Wednesday, January 1, 2014 | 5276000000 | 13215971000 |
| Thursday, January 1, 2015 | 5350000000 | 12711744000 |
| Friday, January 1, 2016 | 5677000000 | 11360753000 |
| Sunday, January 1, 2017 | 6384000000 | 12029312000 |
| Monday, January 1, 2018 | 7057000000 | 14302392000 |
| Tuesday, January 1, 2019 | 7160000000 | 14320324000 |
| Wednesday, January 1, 2020 | 7055000000 | 13695520000 |
| Friday, January 1, 2021 | 8498000000 | 14347640000 |
| Saturday, January 1, 2022 | 9761000000 | 15861608000 |
| Sunday, January 1, 2023 | 9677000000 | 19065194000 |
| Monday, January 1, 2024 | 19929606000 |
Infusing magic into the data realm
In the competitive landscape of industrial manufacturing, Parker-Hannifin Corporation and Owens Corning have been key players. Over the past decade, Parker-Hannifin has consistently outperformed Owens Corning in terms of revenue. From 2014 to 2023, Parker-Hannifin's revenue grew by approximately 44%, peaking at nearly $19 billion in 2023. In contrast, Owens Corning saw a 83% increase, reaching close to $9.7 billion in the same year.
Parker-Hannifin's revenue trajectory highlights its robust market position, with a steady annual growth rate. Despite a dip in 2016, the company rebounded strongly, showcasing resilience and strategic prowess. Meanwhile, Owens Corning's revenue growth, though slower, reflects its steady expansion in the building materials sector.
As we move into 2024, Parker-Hannifin's revenue data is available, but Owens Corning's is yet to be reported, leaving room for speculation on future trends.
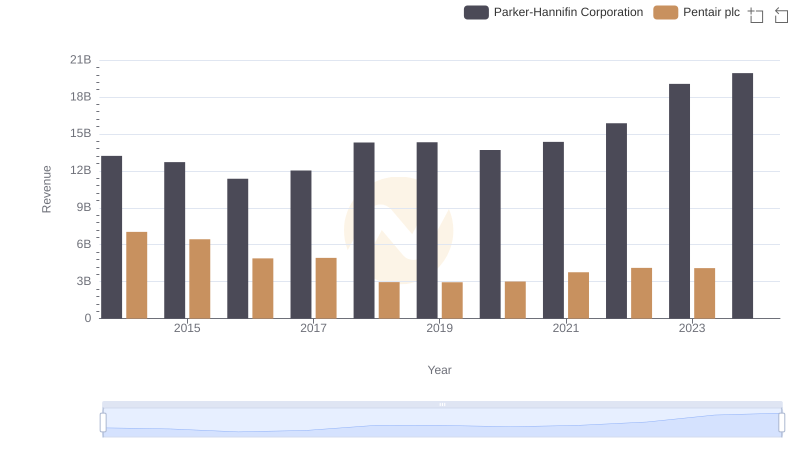
Annual Revenue Comparison: Parker-Hannifin Corporation vs Pentair plc
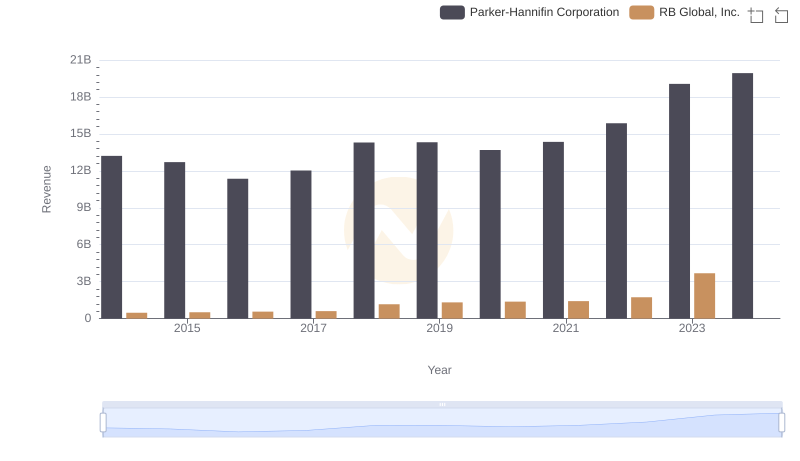
Breaking Down Revenue Trends: Parker-Hannifin Corporation vs RB Global, Inc.

Revenue Insights: Parker-Hannifin Corporation and Expeditors International of Washington, Inc. Performance Compared

Parker-Hannifin Corporation or China Eastern Airlines Corporation Limited: Who Leads in Yearly Revenue?

Parker-Hannifin Corporation and XPO Logistics, Inc.: A Comprehensive Revenue Analysis
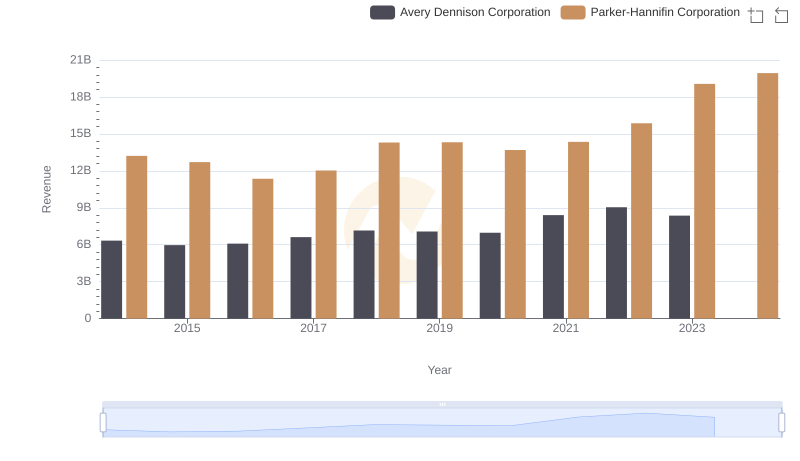
Comparing Revenue Performance: Parker-Hannifin Corporation or Avery Dennison Corporation?
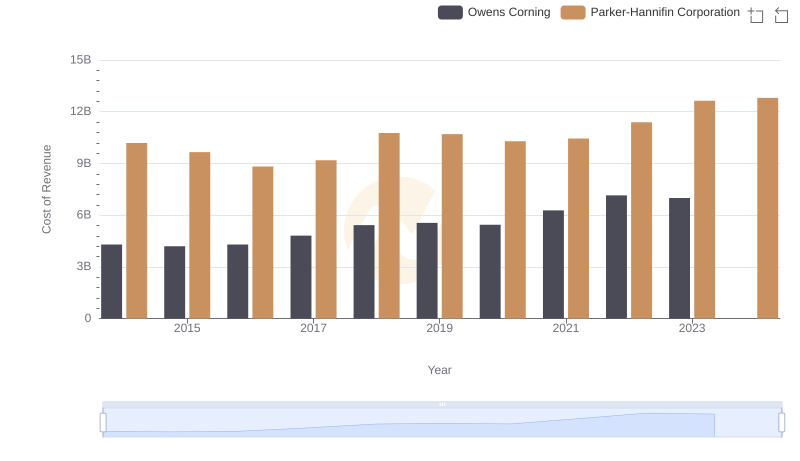
Parker-Hannifin Corporation vs Owens Corning: Efficiency in Cost of Revenue Explored
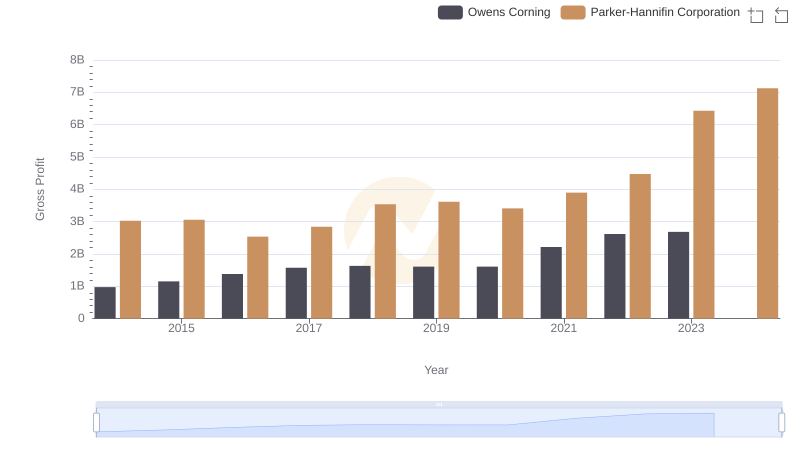
Gross Profit Trends Compared: Parker-Hannifin Corporation vs Owens Corning
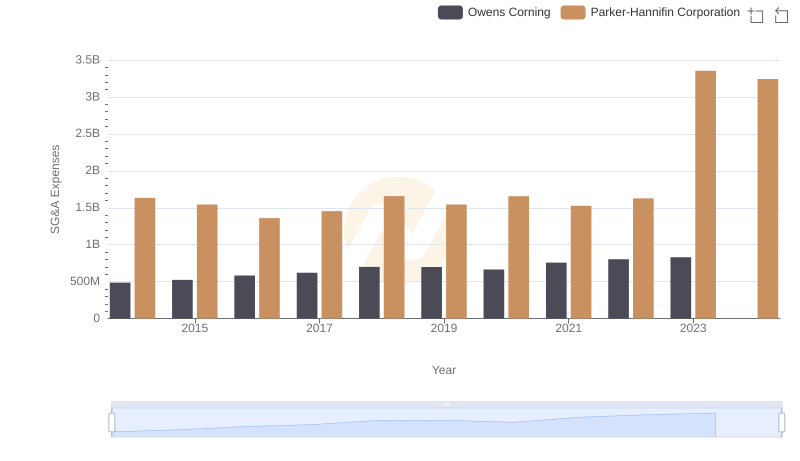
Operational Costs Compared: SG&A Analysis of Parker-Hannifin Corporation and Owens Corning
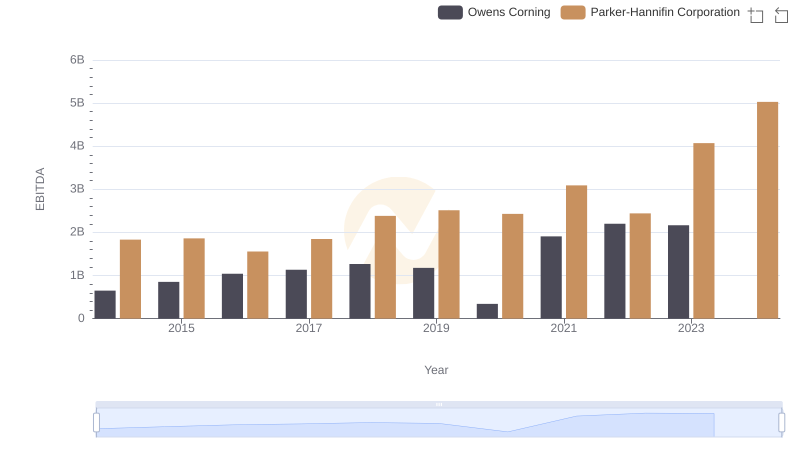
Parker-Hannifin Corporation and Owens Corning: A Detailed Examination of EBITDA Performance