| __timestamp | Avery Dennison Corporation | Parker-Hannifin Corporation |
|---|---|---|
| Wednesday, January 1, 2014 | 4679100000 | 10188227000 |
| Thursday, January 1, 2015 | 4321100000 | 9655245000 |
| Friday, January 1, 2016 | 4386800000 | 8823384000 |
| Sunday, January 1, 2017 | 4801600000 | 9188962000 |
| Monday, January 1, 2018 | 5243500000 | 10762841000 |
| Tuesday, January 1, 2019 | 5166000000 | 10703484000 |
| Wednesday, January 1, 2020 | 5048200000 | 10286518000 |
| Friday, January 1, 2021 | 6095500000 | 10449680000 |
| Saturday, January 1, 2022 | 6635100000 | 11387267000 |
| Sunday, January 1, 2023 | 6086800000 | 12635892000 |
| Monday, January 1, 2024 | 6225000000 | 12801816000 |
Unleashing the power of data
In the ever-evolving landscape of industrial and manufacturing sectors, Parker-Hannifin Corporation and Avery Dennison Corporation stand as titans. Over the past decade, from 2014 to 2023, these companies have showcased intriguing trends in their cost of revenue. Parker-Hannifin, a leader in motion and control technologies, has seen its cost of revenue grow by approximately 24%, peaking in 2023. Meanwhile, Avery Dennison, a global materials science company, experienced a 30% increase, with a notable surge in 2022. This data highlights the resilience and adaptability of these corporations amidst economic fluctuations. However, the absence of data for Avery Dennison in 2024 leaves room for speculation. As these companies continue to innovate, understanding their financial trajectories offers valuable insights into their strategic priorities and market positioning.
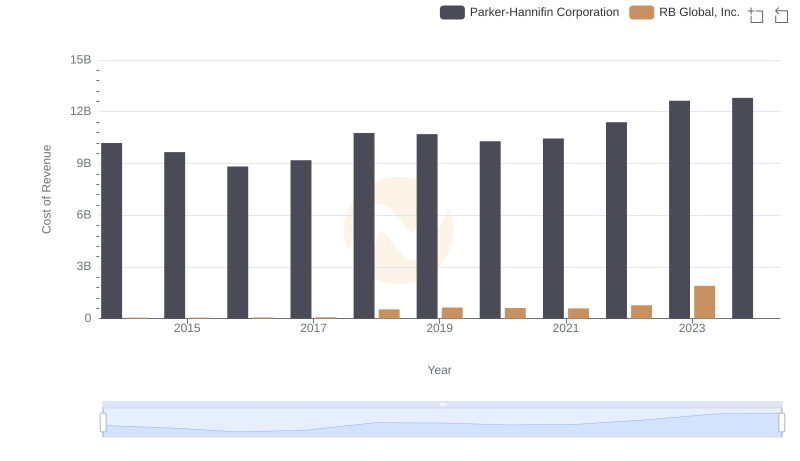
Cost Insights: Breaking Down Parker-Hannifin Corporation and RB Global, Inc.'s Expenses
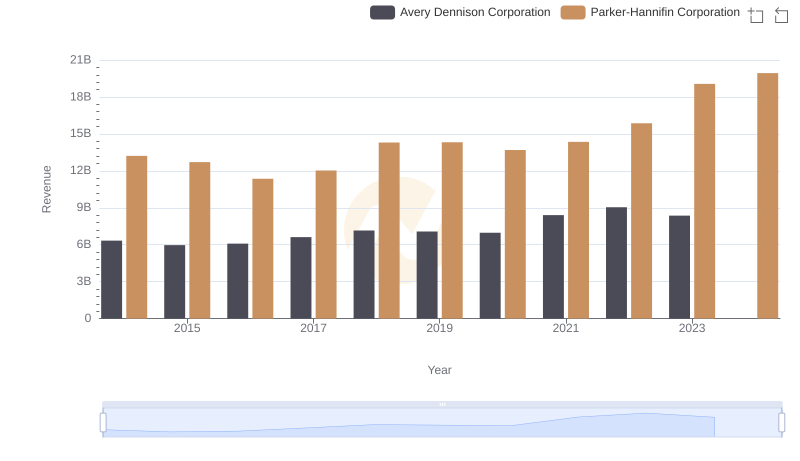
Comparing Revenue Performance: Parker-Hannifin Corporation or Avery Dennison Corporation?
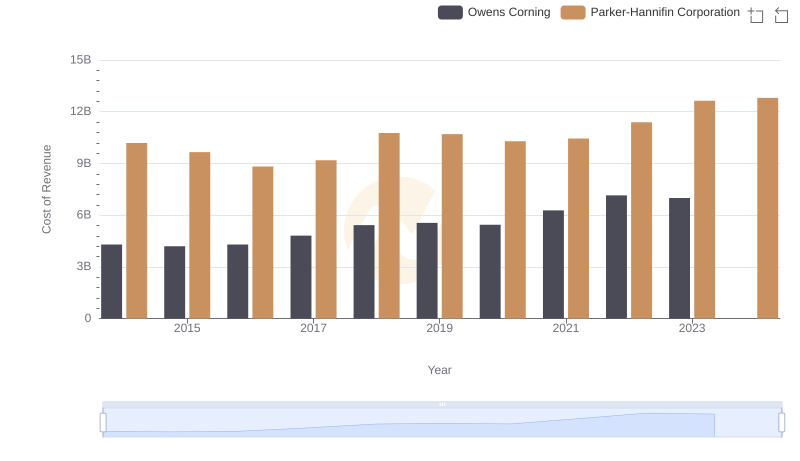
Parker-Hannifin Corporation vs Owens Corning: Efficiency in Cost of Revenue Explored
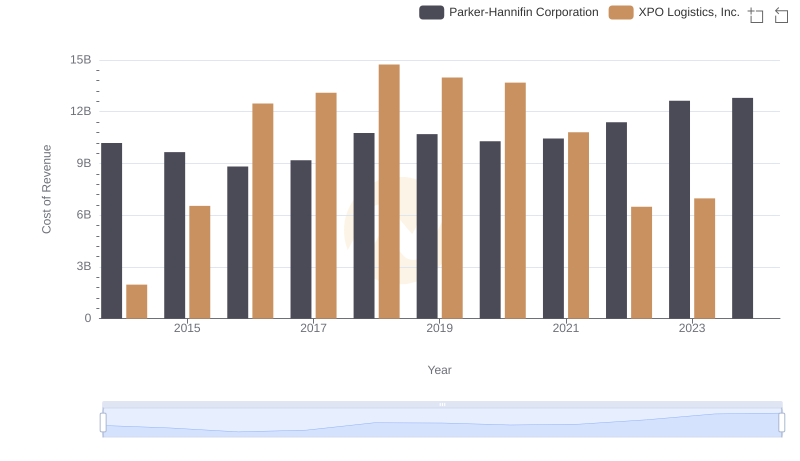
Cost of Revenue Comparison: Parker-Hannifin Corporation vs XPO Logistics, Inc.
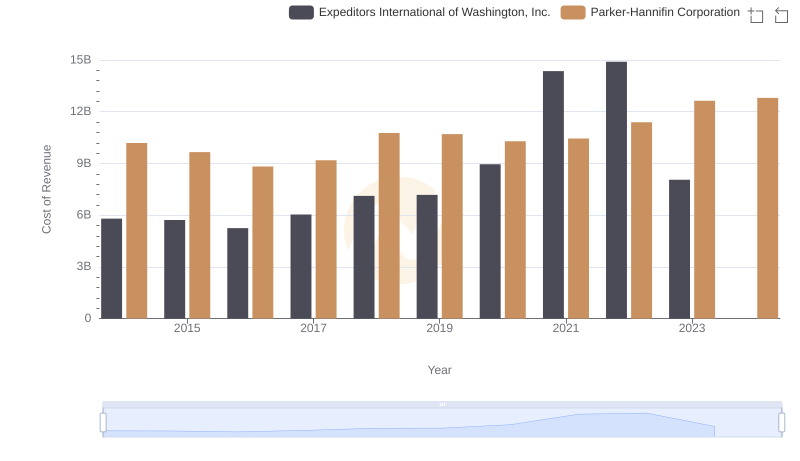
Cost of Revenue: Key Insights for Parker-Hannifin Corporation and Expeditors International of Washington, Inc.
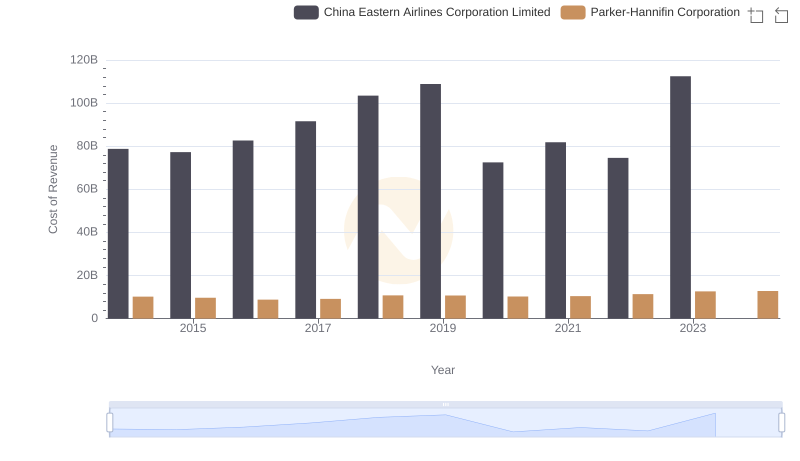
Cost of Revenue Trends: Parker-Hannifin Corporation vs China Eastern Airlines Corporation Limited
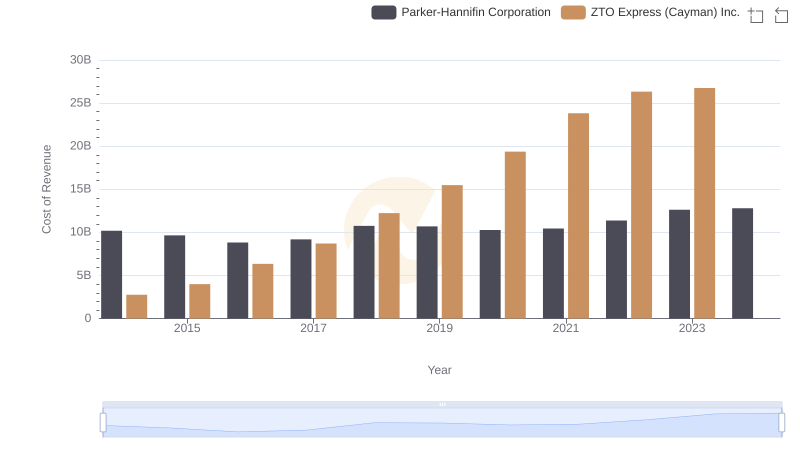
Cost of Revenue Trends: Parker-Hannifin Corporation vs ZTO Express (Cayman) Inc.
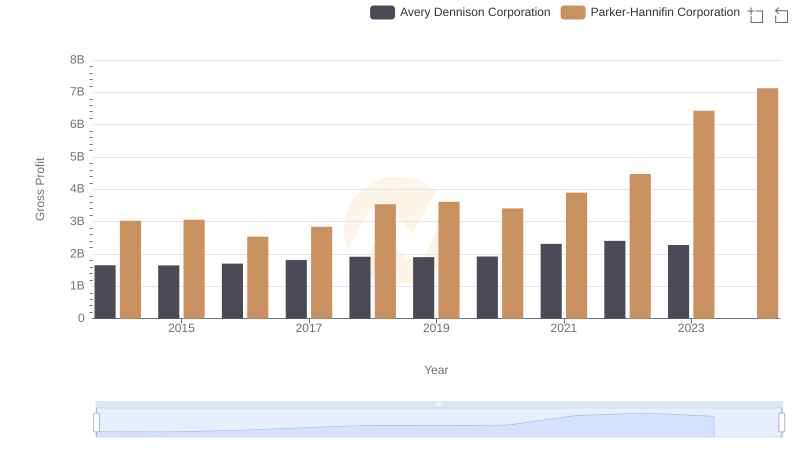
Gross Profit Comparison: Parker-Hannifin Corporation and Avery Dennison Corporation Trends
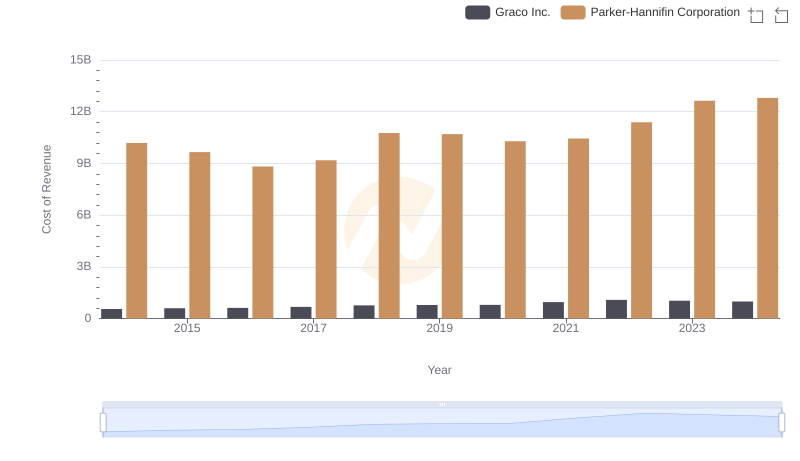
Cost of Revenue: Key Insights for Parker-Hannifin Corporation and Graco Inc.
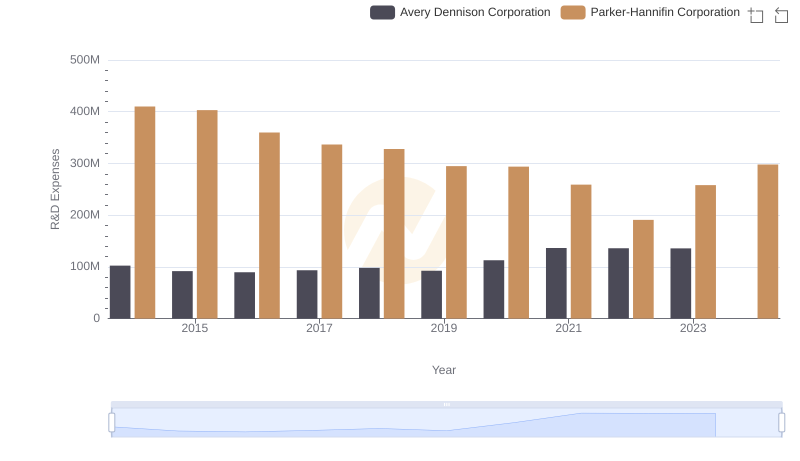
Analyzing R&D Budgets: Parker-Hannifin Corporation vs Avery Dennison Corporation
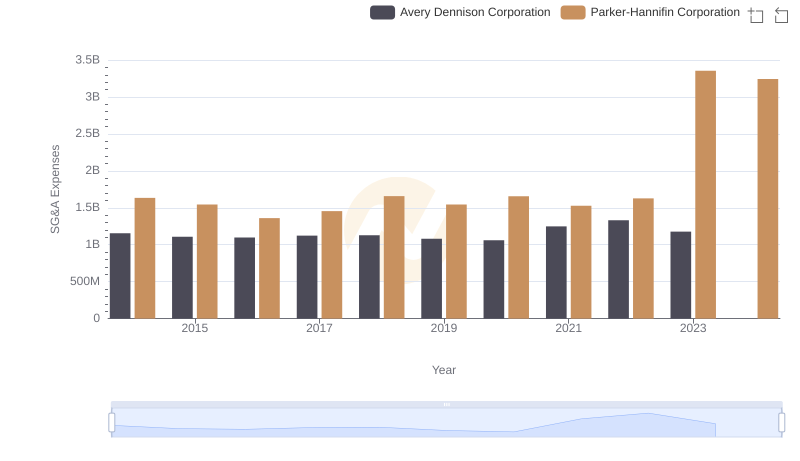
Parker-Hannifin Corporation and Avery Dennison Corporation: SG&A Spending Patterns Compared
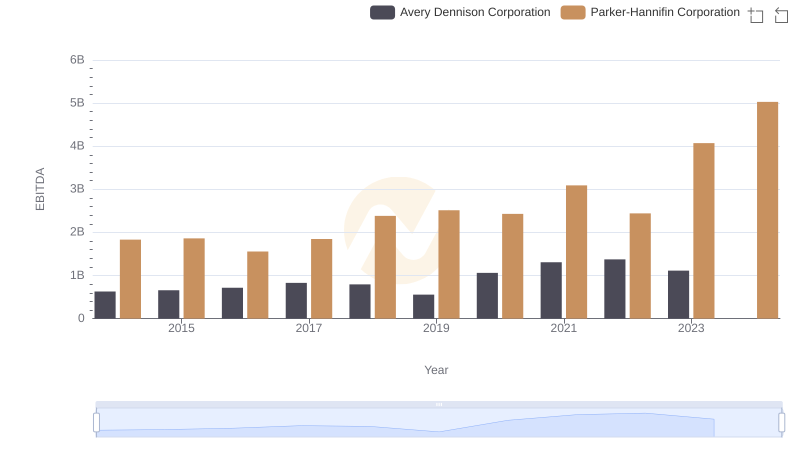
EBITDA Metrics Evaluated: Parker-Hannifin Corporation vs Avery Dennison Corporation