| __timestamp | Parker-Hannifin Corporation | XPO Logistics, Inc. |
|---|---|---|
| Wednesday, January 1, 2014 | 10188227000 | 1975000000 |
| Thursday, January 1, 2015 | 9655245000 | 6538400000 |
| Friday, January 1, 2016 | 8823384000 | 12480100000 |
| Sunday, January 1, 2017 | 9188962000 | 13101100000 |
| Monday, January 1, 2018 | 10762841000 | 14738000000 |
| Tuesday, January 1, 2019 | 10703484000 | 13982000000 |
| Wednesday, January 1, 2020 | 10286518000 | 13689000000 |
| Friday, January 1, 2021 | 10449680000 | 10812000000 |
| Saturday, January 1, 2022 | 11387267000 | 6491000000 |
| Sunday, January 1, 2023 | 12635892000 | 6974000000 |
| Monday, January 1, 2024 | 12801816000 | 7157000000 |
Infusing magic into the data realm
In the ever-evolving landscape of industrial and logistics sectors, Parker-Hannifin Corporation and XPO Logistics, Inc. stand as titans. From 2014 to 2023, Parker-Hannifin's cost of revenue has shown a steady upward trajectory, peaking at approximately $12.6 billion in 2023, a 24% increase from 2014. In contrast, XPO Logistics experienced a dramatic rise, reaching its zenith in 2018 with a cost of revenue of around $14.7 billion, before declining to $6.97 billion in 2023. This fluctuation highlights the dynamic nature of the logistics industry, influenced by global supply chain challenges and market demands. Notably, data for 2024 is incomplete, reflecting the unpredictable nature of future market conditions. As these companies navigate the complexities of their respective industries, their financial strategies will be pivotal in shaping their competitive edge.
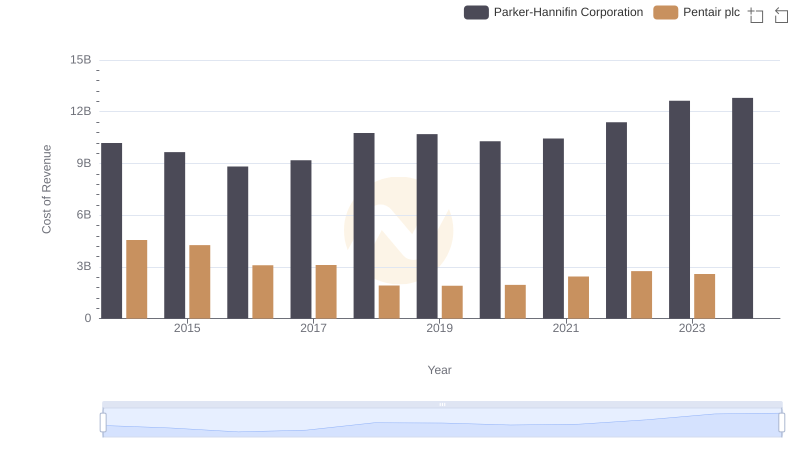
Cost Insights: Breaking Down Parker-Hannifin Corporation and Pentair plc's Expenses

Parker-Hannifin Corporation and XPO Logistics, Inc.: A Comprehensive Revenue Analysis
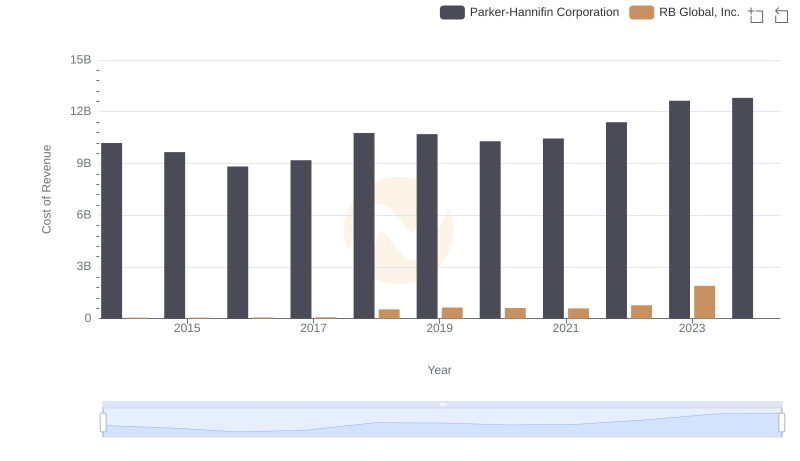
Cost Insights: Breaking Down Parker-Hannifin Corporation and RB Global, Inc.'s Expenses
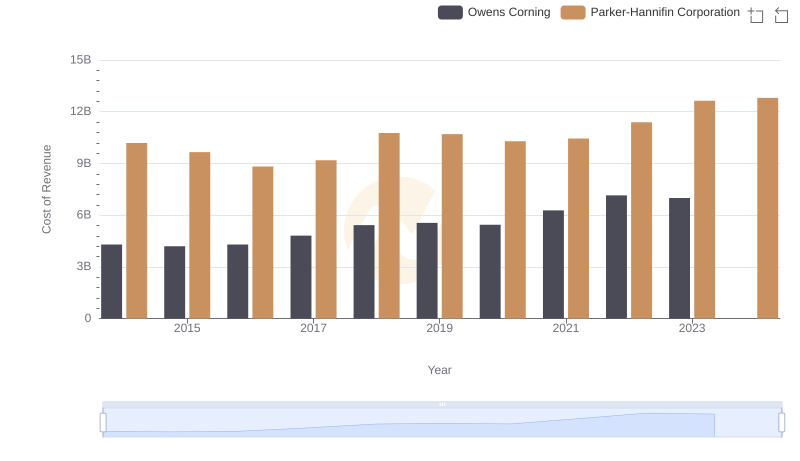
Parker-Hannifin Corporation vs Owens Corning: Efficiency in Cost of Revenue Explored
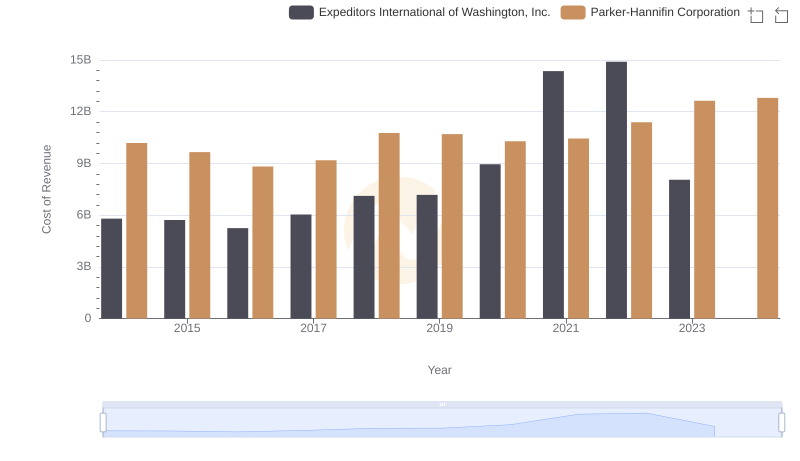
Cost of Revenue: Key Insights for Parker-Hannifin Corporation and Expeditors International of Washington, Inc.
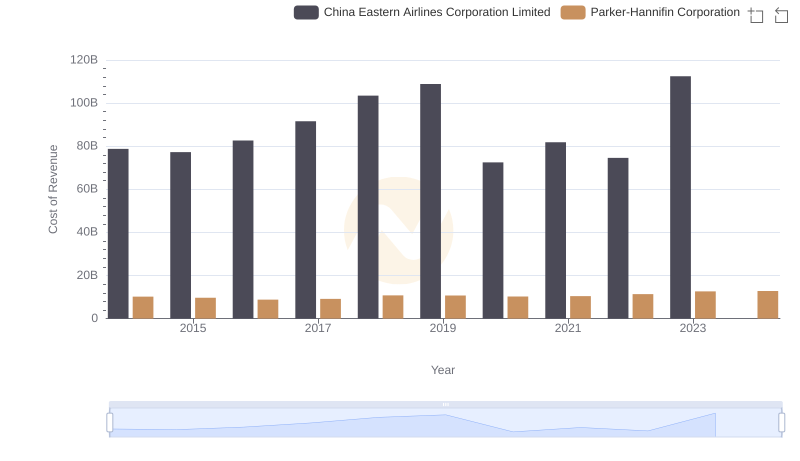
Cost of Revenue Trends: Parker-Hannifin Corporation vs China Eastern Airlines Corporation Limited
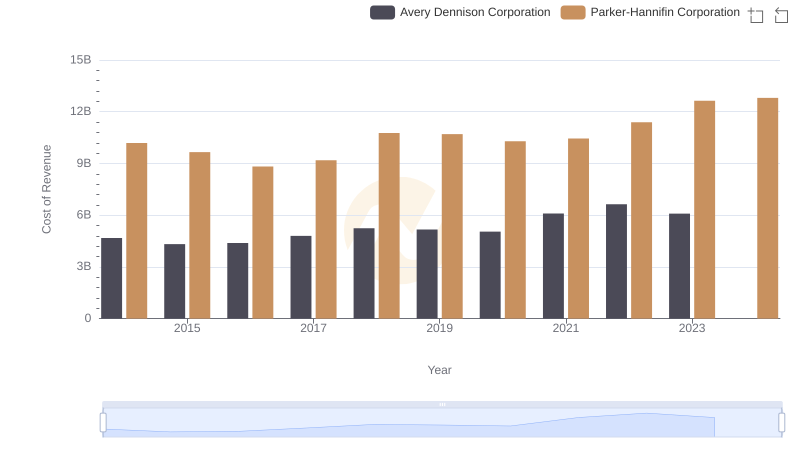
Cost of Revenue Trends: Parker-Hannifin Corporation vs Avery Dennison Corporation
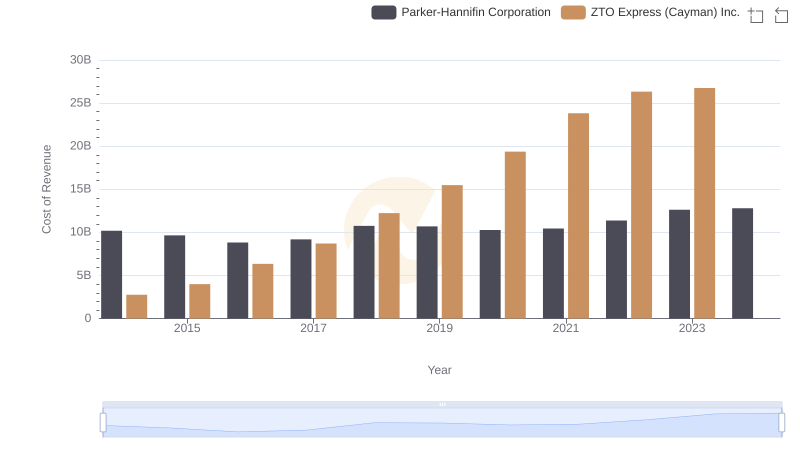
Cost of Revenue Trends: Parker-Hannifin Corporation vs ZTO Express (Cayman) Inc.
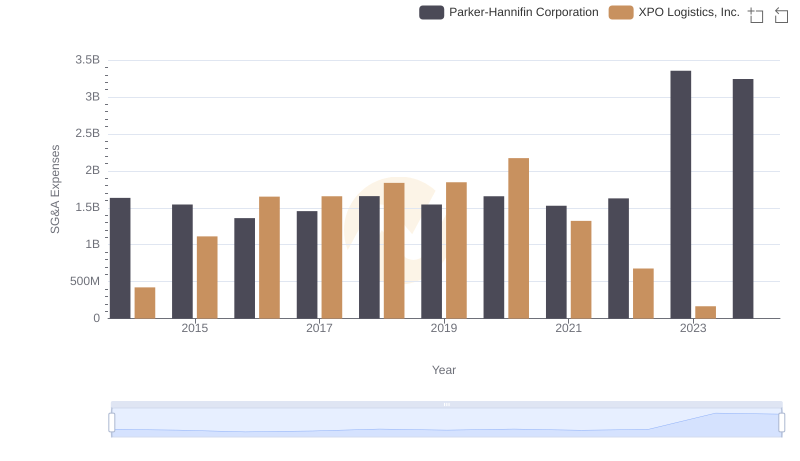
Parker-Hannifin Corporation vs XPO Logistics, Inc.: SG&A Expense Trends