| __timestamp | Parker-Hannifin Corporation | TransUnion |
|---|---|---|
| Wednesday, January 1, 2014 | 13215971000 | 1304700000 |
| Thursday, January 1, 2015 | 12711744000 | 1506800000 |
| Friday, January 1, 2016 | 11360753000 | 1704900000 |
| Sunday, January 1, 2017 | 12029312000 | 1933800000 |
| Monday, January 1, 2018 | 14302392000 | 2317200000 |
| Tuesday, January 1, 2019 | 14320324000 | 2656100000 |
| Wednesday, January 1, 2020 | 13695520000 | 2716600000 |
| Friday, January 1, 2021 | 14347640000 | 2960200000 |
| Saturday, January 1, 2022 | 15861608000 | 3709900000 |
| Sunday, January 1, 2023 | 19065194000 | 3831200000 |
| Monday, January 1, 2024 | 19929606000 | 4183800000 |
Unlocking the unknown
In the ever-evolving landscape of American industry, Parker-Hannifin Corporation and TransUnion stand as titans in their respective fields. Over the past decade, Parker-Hannifin, a leader in motion and control technologies, has consistently outpaced TransUnion, a global information and insights company, in terms of yearly revenue. From 2014 to 2023, Parker-Hannifin's revenue surged by approximately 51%, reaching nearly $20 billion in 2023. In contrast, TransUnion's revenue grew by about 194% over the same period, peaking at nearly $3.8 billion in 2023.
While Parker-Hannifin's revenue is significantly higher, TransUnion's impressive growth rate highlights its dynamic expansion in the data-driven economy. The data for 2024 is incomplete, but the trends suggest continued growth for both companies. This comparison underscores the diverse strategies and market positions of these two industry leaders.
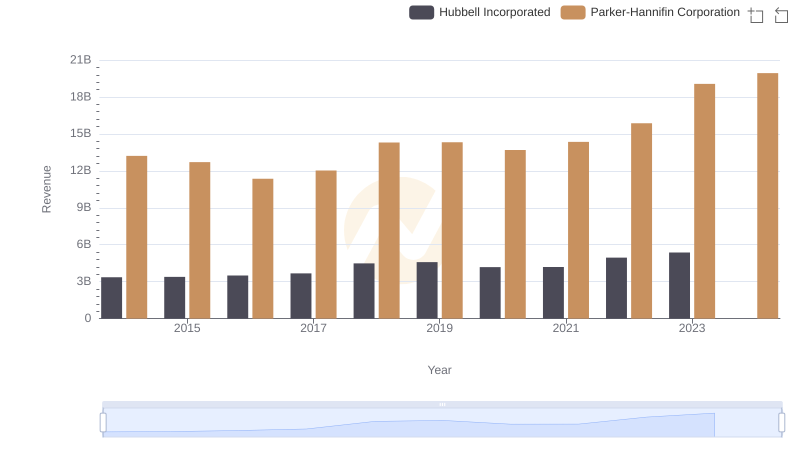
Parker-Hannifin Corporation or Hubbell Incorporated: Who Leads in Yearly Revenue?
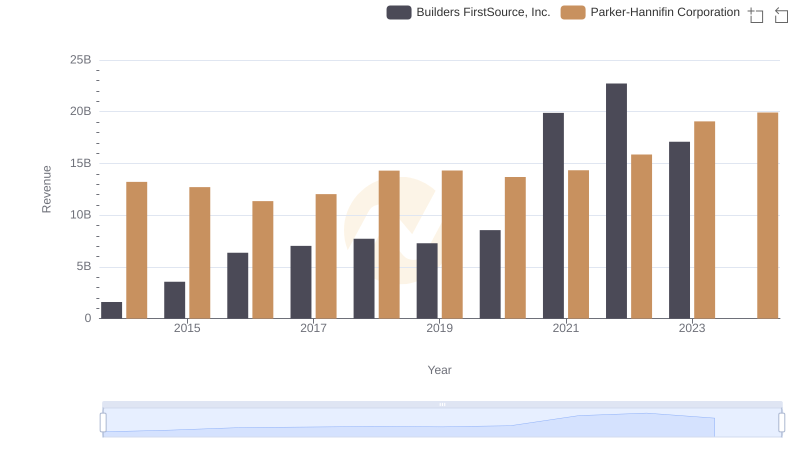
Annual Revenue Comparison: Parker-Hannifin Corporation vs Builders FirstSource, Inc.
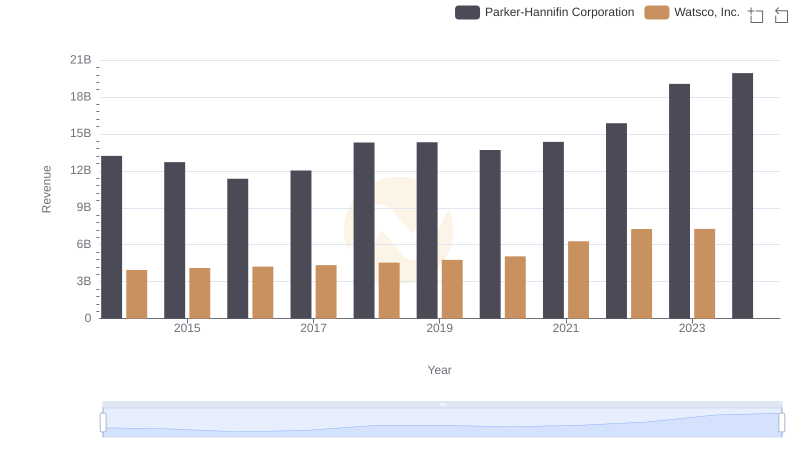
Who Generates More Revenue? Parker-Hannifin Corporation or Watsco, Inc.
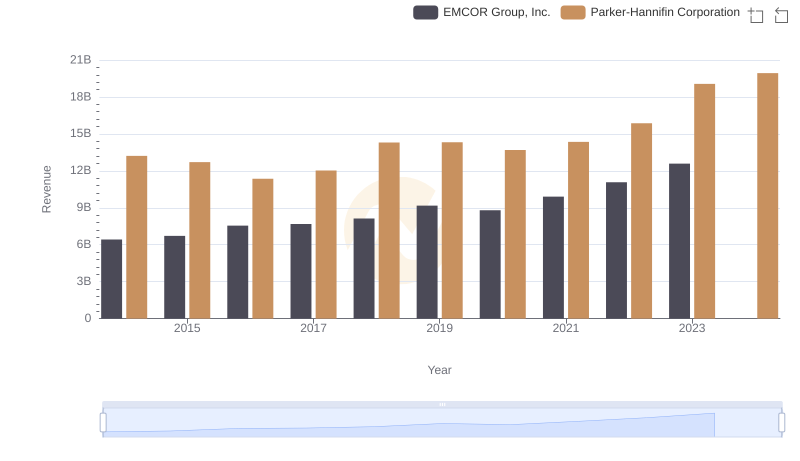
Who Generates More Revenue? Parker-Hannifin Corporation or EMCOR Group, Inc.
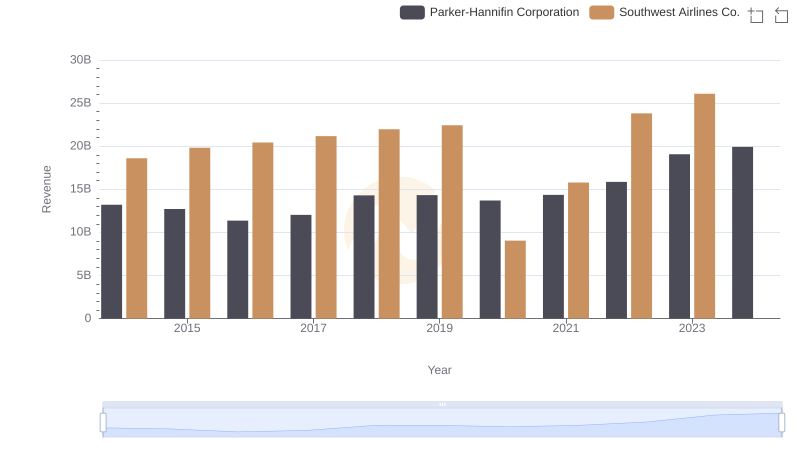
Parker-Hannifin Corporation vs Southwest Airlines Co.: Examining Key Revenue Metrics
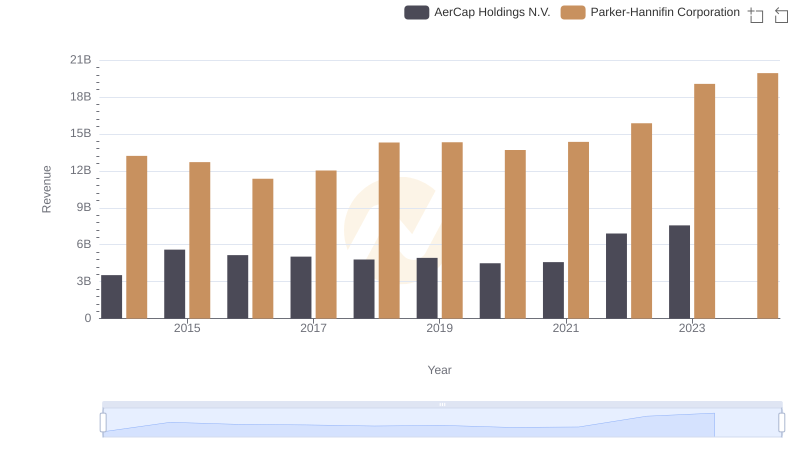
Annual Revenue Comparison: Parker-Hannifin Corporation vs AerCap Holdings N.V.
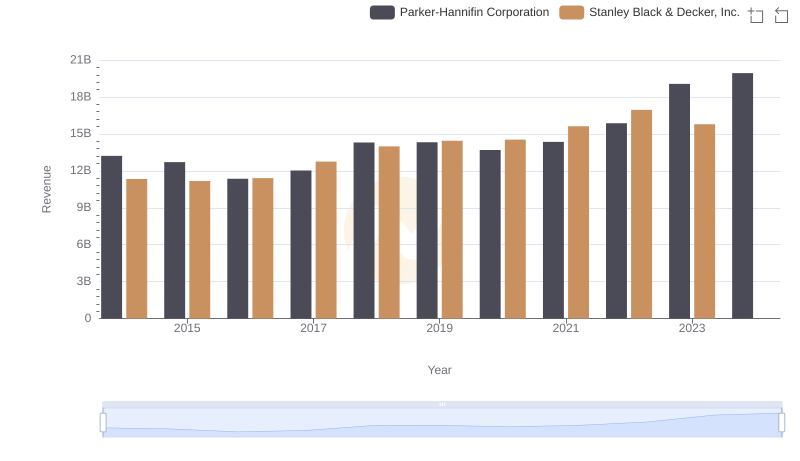
Parker-Hannifin Corporation and Stanley Black & Decker, Inc.: A Comprehensive Revenue Analysis

Cost of Revenue Comparison: Parker-Hannifin Corporation vs TransUnion
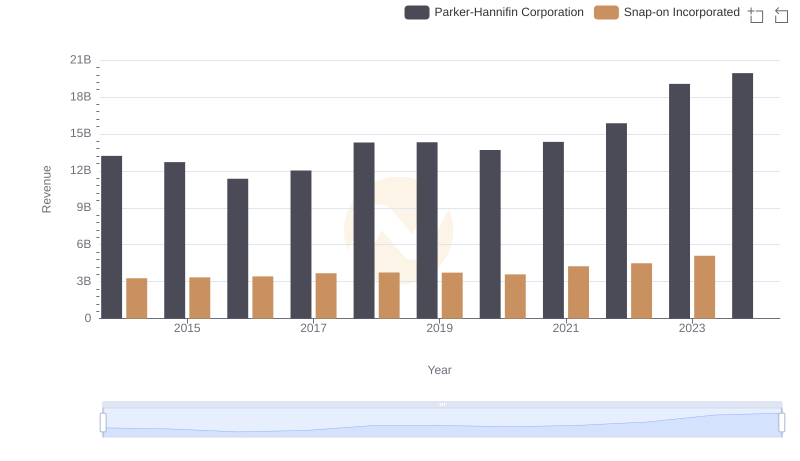
Revenue Showdown: Parker-Hannifin Corporation vs Snap-on Incorporated
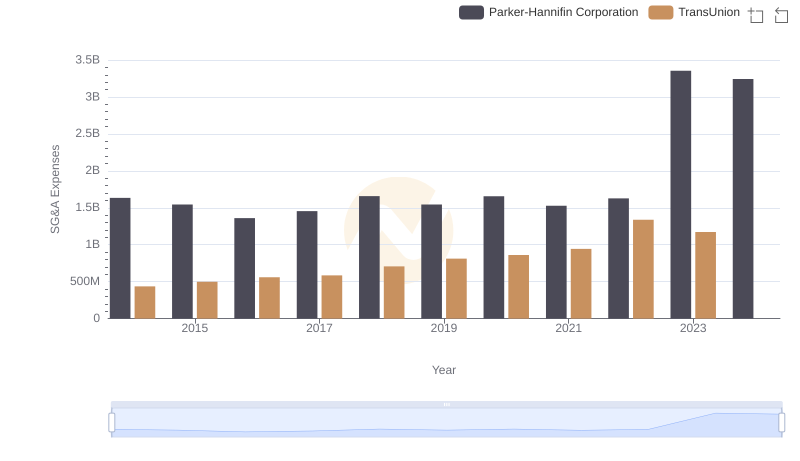
Selling, General, and Administrative Costs: Parker-Hannifin Corporation vs TransUnion