| __timestamp | Elbit Systems Ltd. | Waste Connections, Inc. |
|---|---|---|
| Wednesday, January 1, 2014 | 356171000 | 229474000 |
| Thursday, January 1, 2015 | 385059000 | 237484000 |
| Friday, January 1, 2016 | 422390000 | 474263000 |
| Sunday, January 1, 2017 | 413560000 | 509638000 |
| Monday, January 1, 2018 | 441362000 | 524388000 |
| Tuesday, January 1, 2019 | 516149000 | 546278000 |
| Wednesday, January 1, 2020 | 514638000 | 537632000 |
| Friday, January 1, 2021 | 559113000 | 612337000 |
| Saturday, January 1, 2022 | 639067000 | 696467000 |
| Sunday, January 1, 2023 | 696022000 | 799119000 |
| Monday, January 1, 2024 | 883445000 |
Igniting the spark of knowledge
In the ever-evolving landscape of corporate finance, understanding the nuances of Selling, General, and Administrative (SG&A) expenses is crucial. Waste Connections, Inc. and Elbit Systems Ltd. offer a fascinating study in contrasts. From 2014 to 2023, Waste Connections, Inc. saw a remarkable 248% increase in SG&A expenses, reflecting its aggressive growth strategy. Meanwhile, Elbit Systems Ltd. experienced a 95% rise, indicating steady expansion.
The data reveals that Waste Connections, Inc. consistently outpaced Elbit Systems Ltd. in SG&A spending, particularly from 2016 onwards. By 2023, Waste Connections, Inc.'s SG&A expenses were approximately 15% higher than Elbit Systems Ltd.'s, underscoring its commitment to scaling operations. This trend highlights the diverse strategies companies employ to navigate market challenges and opportunities. As businesses continue to adapt, monitoring SG&A trends remains vital for investors and analysts alike.
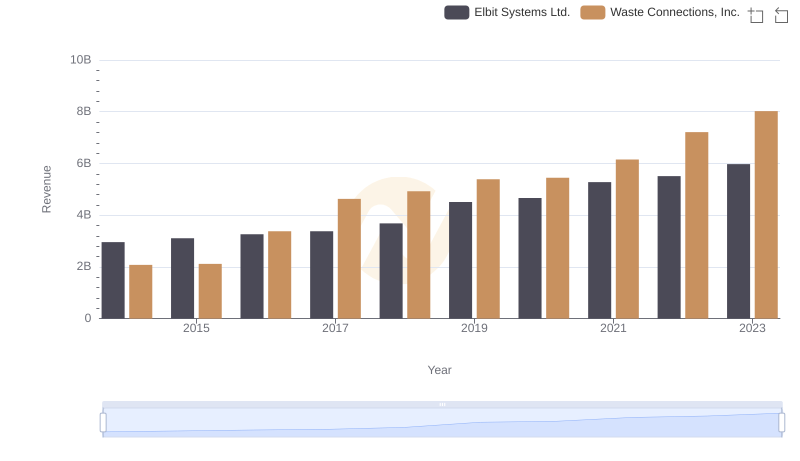
Revenue Showdown: Waste Connections, Inc. vs Elbit Systems Ltd.
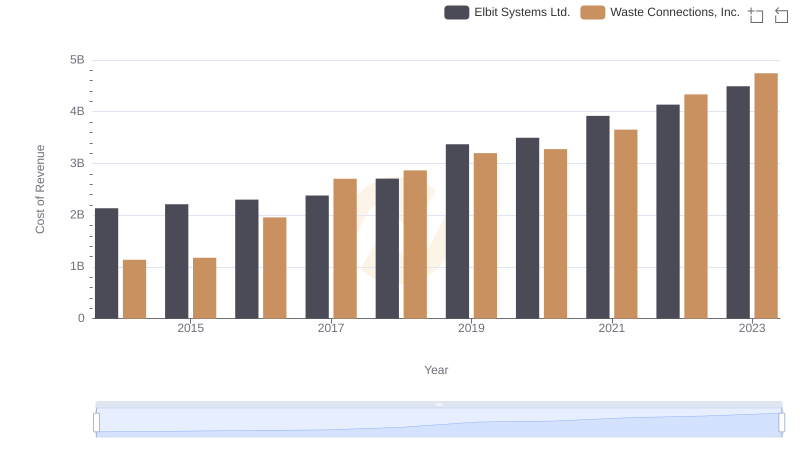
Cost of Revenue Trends: Waste Connections, Inc. vs Elbit Systems Ltd.
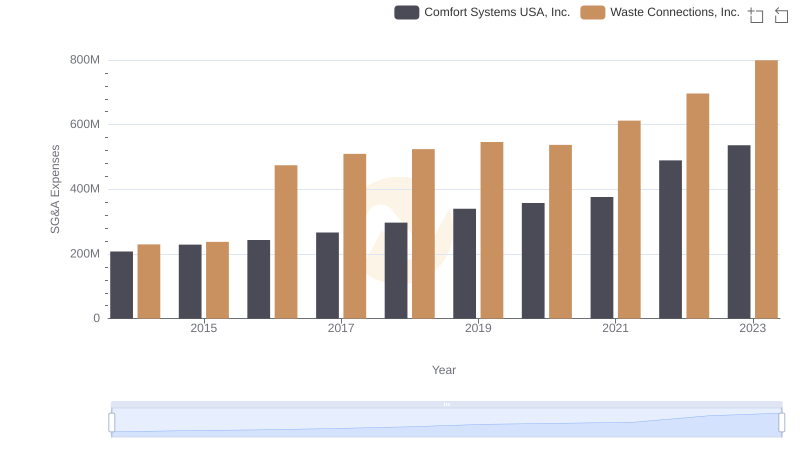
Operational Costs Compared: SG&A Analysis of Waste Connections, Inc. and Comfort Systems USA, Inc.
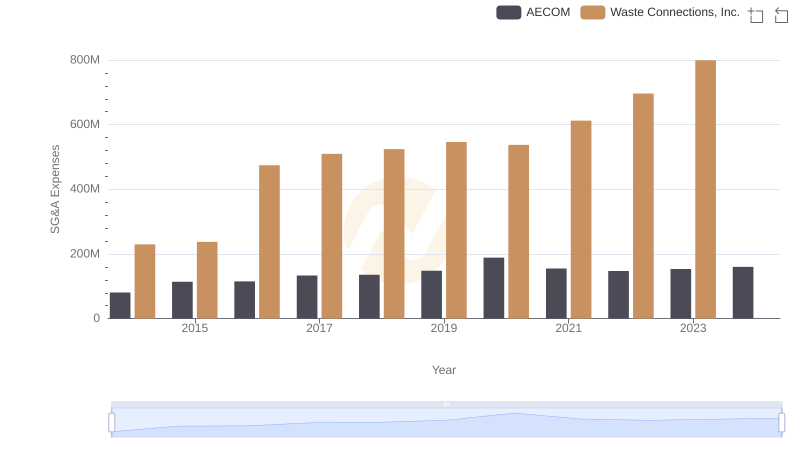
Comparing SG&A Expenses: Waste Connections, Inc. vs AECOM Trends and Insights
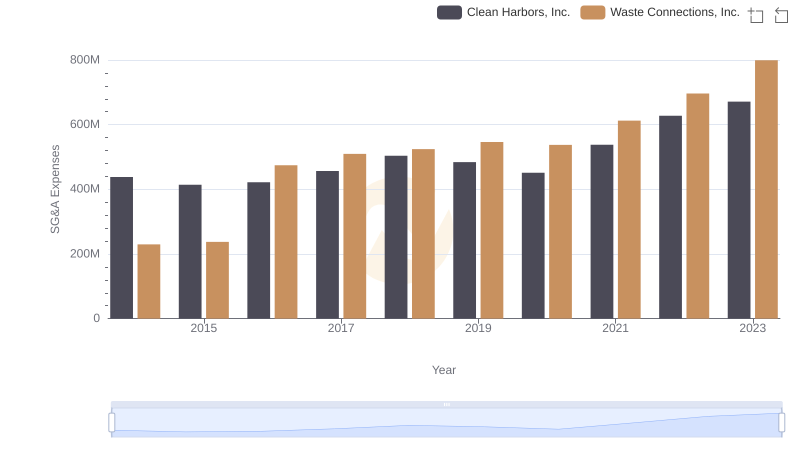
Selling, General, and Administrative Costs: Waste Connections, Inc. vs Clean Harbors, Inc.
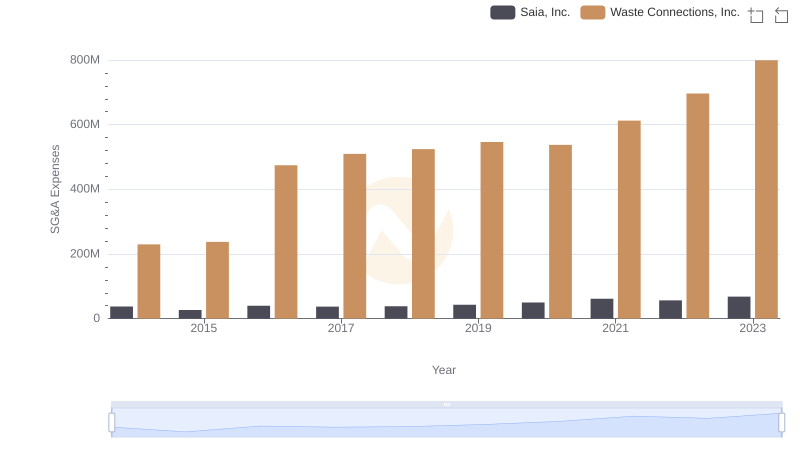
SG&A Efficiency Analysis: Comparing Waste Connections, Inc. and Saia, Inc.
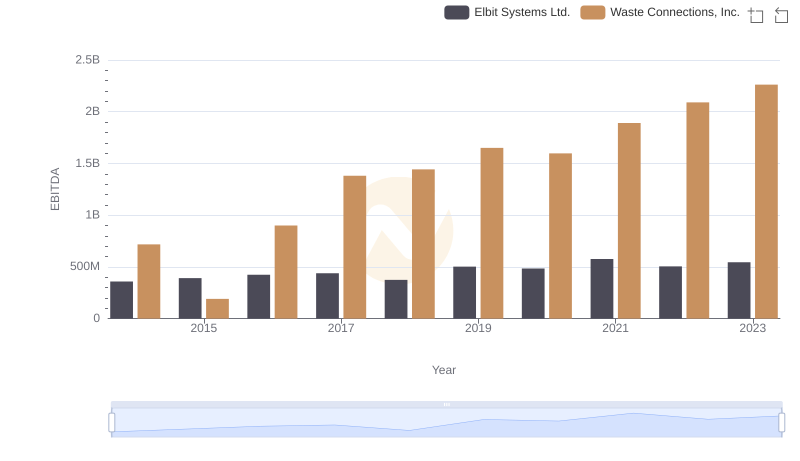
Comprehensive EBITDA Comparison: Waste Connections, Inc. vs Elbit Systems Ltd.