| __timestamp | Howmet Aerospace Inc. | United Rentals, Inc. |
|---|---|---|
| Wednesday, January 1, 2014 | 1927000000 | 1678000000 |
| Thursday, January 1, 2015 | 1936000000 | 2653000000 |
| Friday, January 1, 2016 | 1457000000 | 2566000000 |
| Sunday, January 1, 2017 | 1517000000 | 2843000000 |
| Monday, January 1, 2018 | 1491000000 | 3628000000 |
| Tuesday, January 1, 2019 | 843000000 | 4200000000 |
| Wednesday, January 1, 2020 | 831000000 | 2195000000 |
| Friday, January 1, 2021 | 1095000000 | 2642000000 |
| Saturday, January 1, 2022 | 1260000000 | 5464000000 |
| Sunday, January 1, 2023 | 1465000000 | 6627000000 |
| Monday, January 1, 2024 | 1842000000 | 4516000000 |
Data in motion
In the ever-evolving landscape of industrial giants, United Rentals, Inc. and Howmet Aerospace Inc. have showcased intriguing financial trajectories over the past decade. From 2014 to 2023, United Rentals has consistently outperformed Howmet Aerospace in terms of EBITDA, with a staggering 295% increase from 2014 to 2023. In contrast, Howmet Aerospace experienced a more modest growth of approximately 76% during the same period.
United Rentals' EBITDA peaked in 2023, reaching nearly four times its 2014 value, highlighting its robust expansion strategy. Meanwhile, Howmet Aerospace faced a dip in 2019, with EBITDA dropping to nearly half of its 2014 value, before recovering in subsequent years. The data for 2024 remains incomplete, leaving room for speculation on future trends. This analysis underscores the dynamic nature of the industrial sector and the varying strategies of these two prominent players.

United Rentals, Inc. and Howmet Aerospace Inc.: A Comprehensive Revenue Analysis
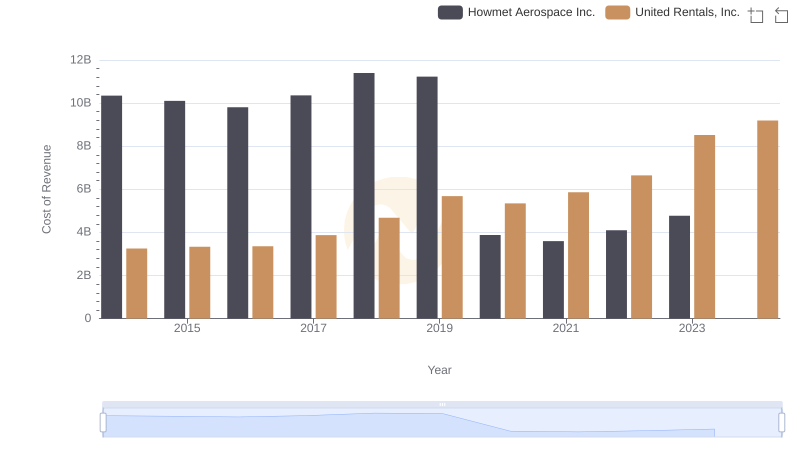
Analyzing Cost of Revenue: United Rentals, Inc. and Howmet Aerospace Inc.
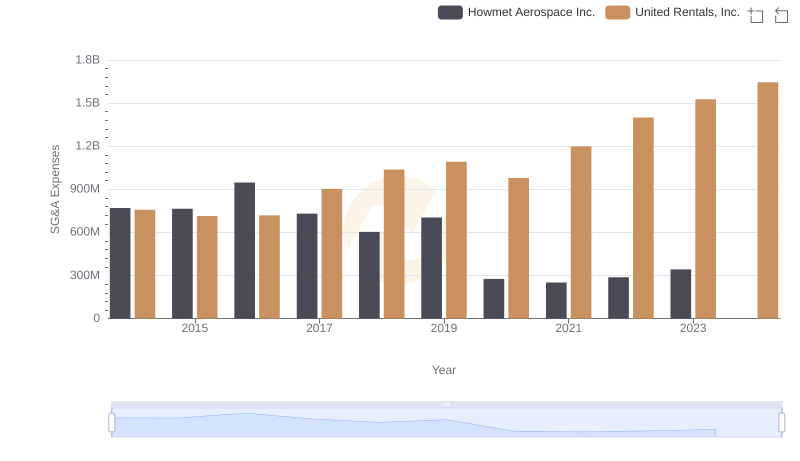
Operational Costs Compared: SG&A Analysis of United Rentals, Inc. and Howmet Aerospace Inc.
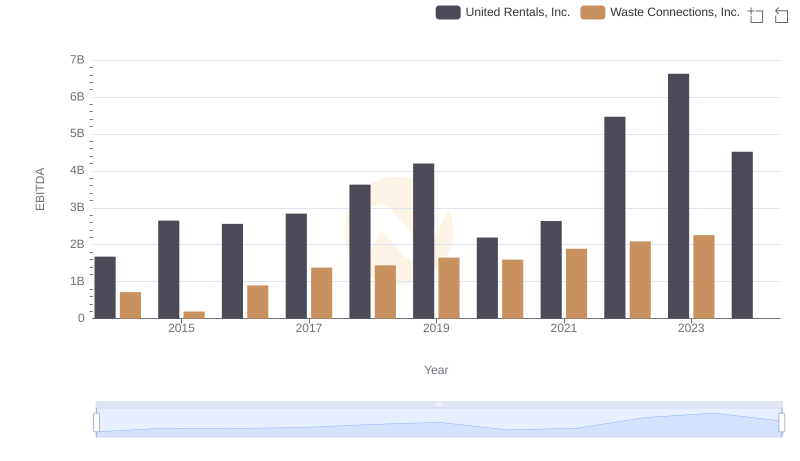
Comparative EBITDA Analysis: United Rentals, Inc. vs Waste Connections, Inc.
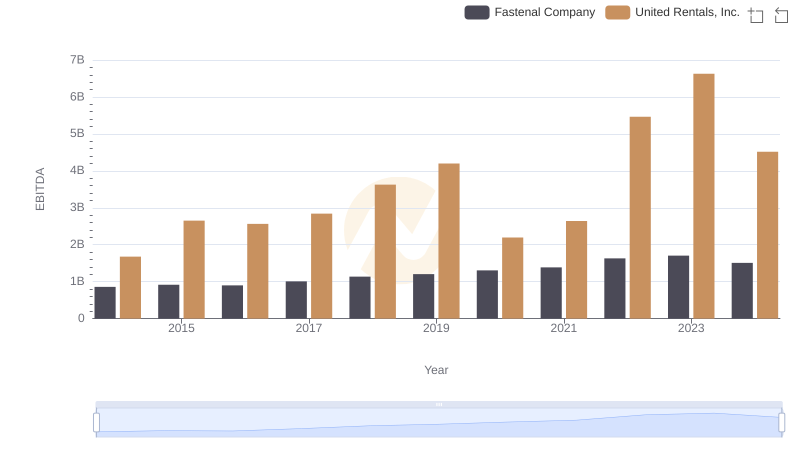
EBITDA Analysis: Evaluating United Rentals, Inc. Against Fastenal Company
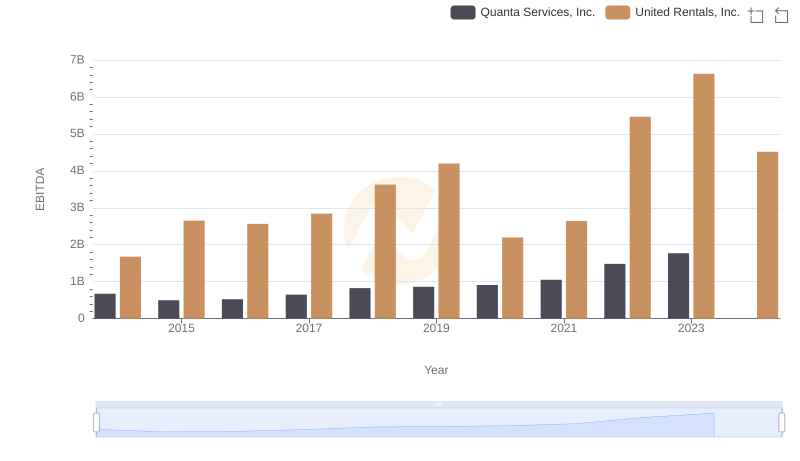
Comprehensive EBITDA Comparison: United Rentals, Inc. vs Quanta Services, Inc.
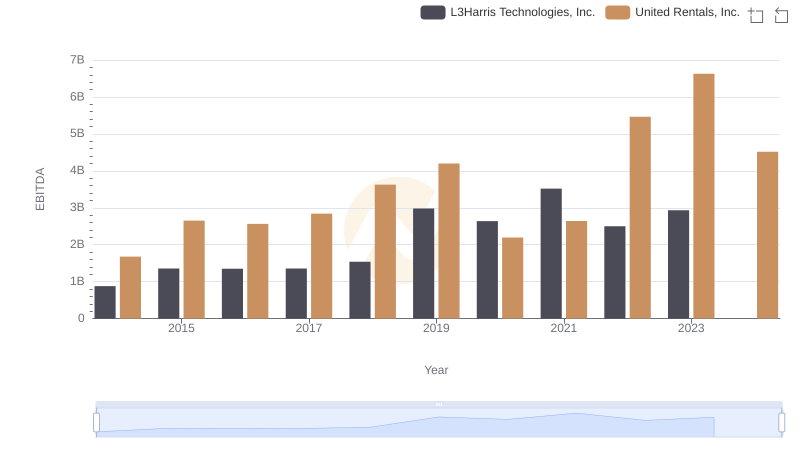
A Professional Review of EBITDA: United Rentals, Inc. Compared to L3Harris Technologies, Inc.
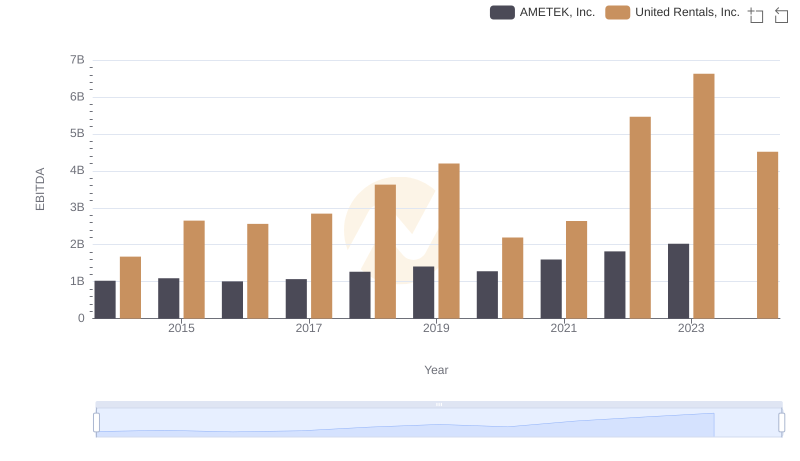
A Side-by-Side Analysis of EBITDA: United Rentals, Inc. and AMETEK, Inc.
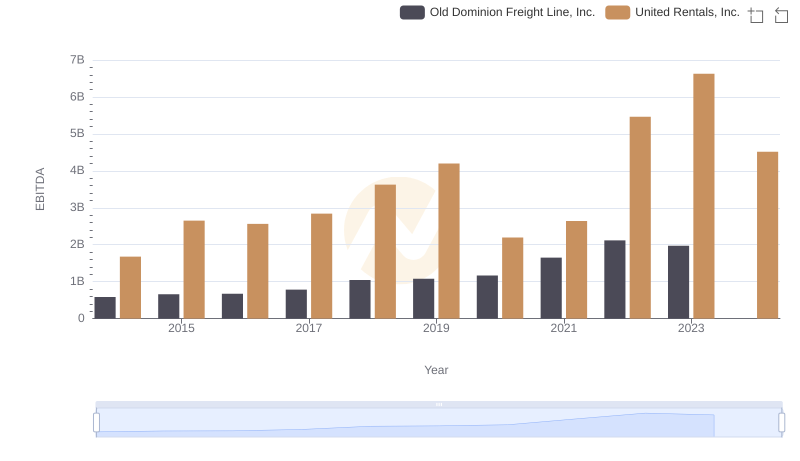
Professional EBITDA Benchmarking: United Rentals, Inc. vs Old Dominion Freight Line, Inc.
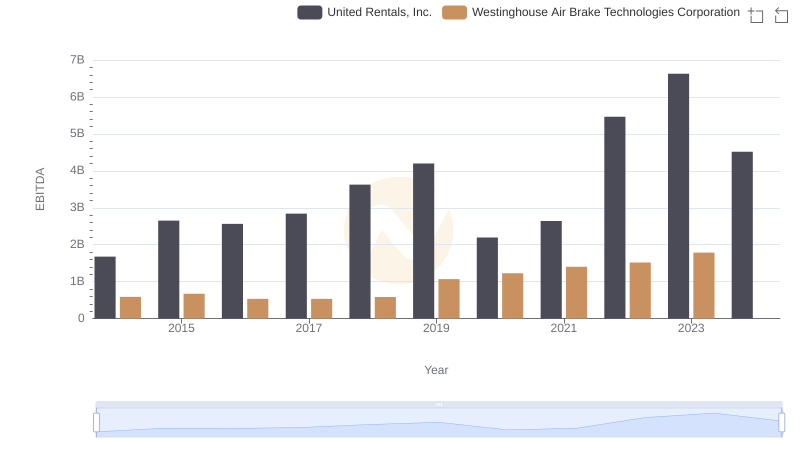
EBITDA Analysis: Evaluating United Rentals, Inc. Against Westinghouse Air Brake Technologies Corporation
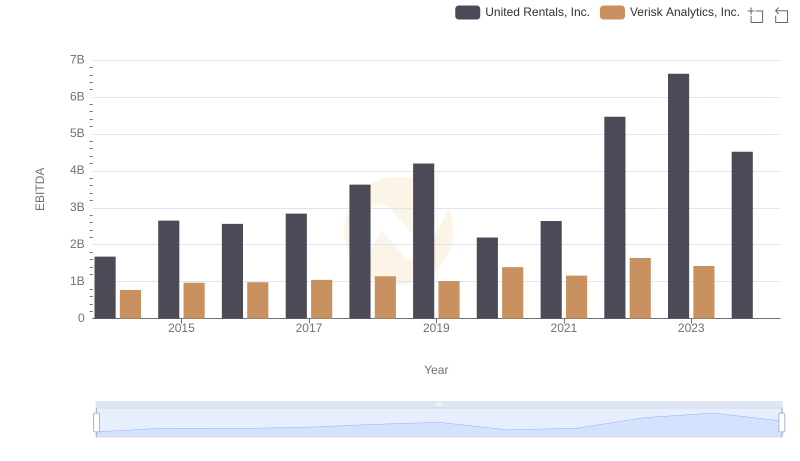
United Rentals, Inc. and Verisk Analytics, Inc.: A Detailed Examination of EBITDA Performance