| __timestamp | Curtiss-Wright Corporation | United Rentals, Inc. |
|---|---|---|
| Wednesday, January 1, 2014 | 426301000 | 758000000 |
| Thursday, January 1, 2015 | 411801000 | 714000000 |
| Friday, January 1, 2016 | 383793000 | 719000000 |
| Sunday, January 1, 2017 | 418544000 | 903000000 |
| Monday, January 1, 2018 | 433110000 | 1038000000 |
| Tuesday, January 1, 2019 | 422272000 | 1092000000 |
| Wednesday, January 1, 2020 | 412825000 | 979000000 |
| Friday, January 1, 2021 | 443096000 | 1199000000 |
| Saturday, January 1, 2022 | 445679000 | 1400000000 |
| Sunday, January 1, 2023 | 496812000 | 1527000000 |
| Monday, January 1, 2024 | 518857000 | 1645000000 |
Unlocking the unknown
In the competitive landscape of industrial services, United Rentals, Inc. and Curtiss-Wright Corporation have showcased distinct trends in their Selling, General, and Administrative (SG&A) expenses over the past decade. From 2014 to 2023, United Rentals has consistently outpaced Curtiss-Wright, with its SG&A expenses growing by approximately 101%, reaching a peak in 2023. In contrast, Curtiss-Wright's expenses have seen a modest increase of about 17% over the same period.
United Rentals' aggressive expansion strategy is evident in its rising SG&A costs, which reflect its commitment to scaling operations. Meanwhile, Curtiss-Wright's steady expense management highlights its focus on efficiency and stability. The data for 2024 is incomplete, but the trends suggest a continued divergence in their financial strategies. This analysis provides a window into how these industry leaders allocate resources to maintain their market positions.
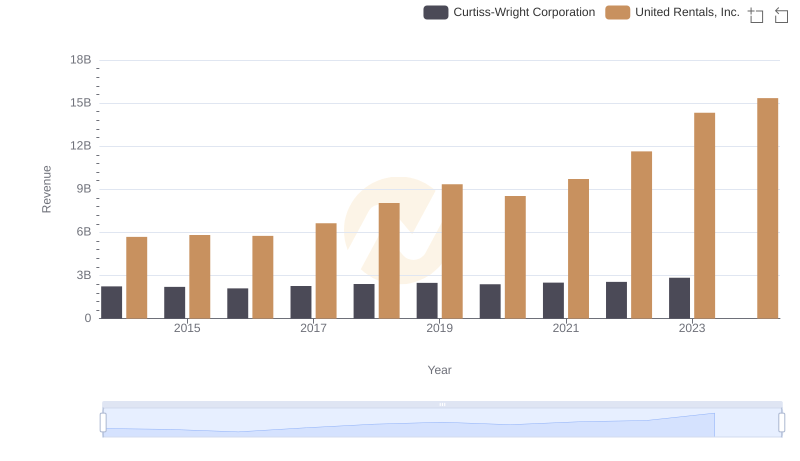
Who Generates More Revenue? United Rentals, Inc. or Curtiss-Wright Corporation
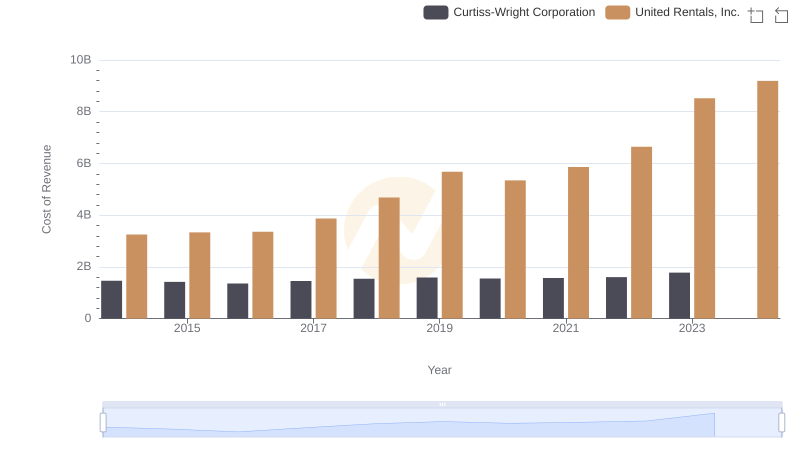
Cost of Revenue Trends: United Rentals, Inc. vs Curtiss-Wright Corporation
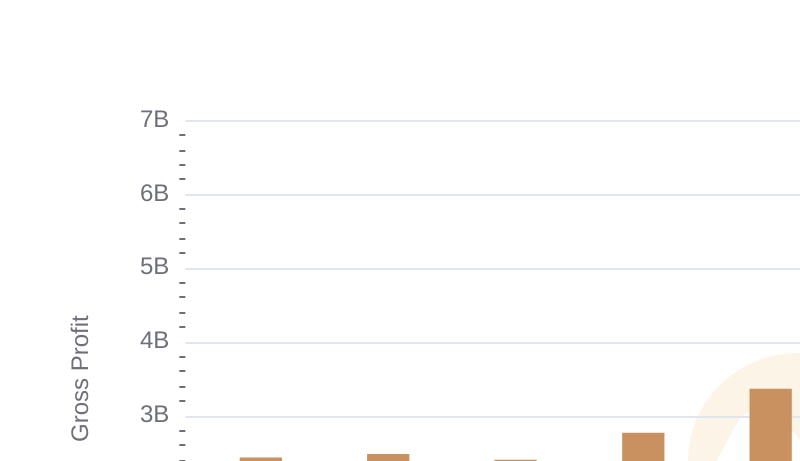
United Rentals, Inc. and Curtiss-Wright Corporation: A Detailed Gross Profit Analysis
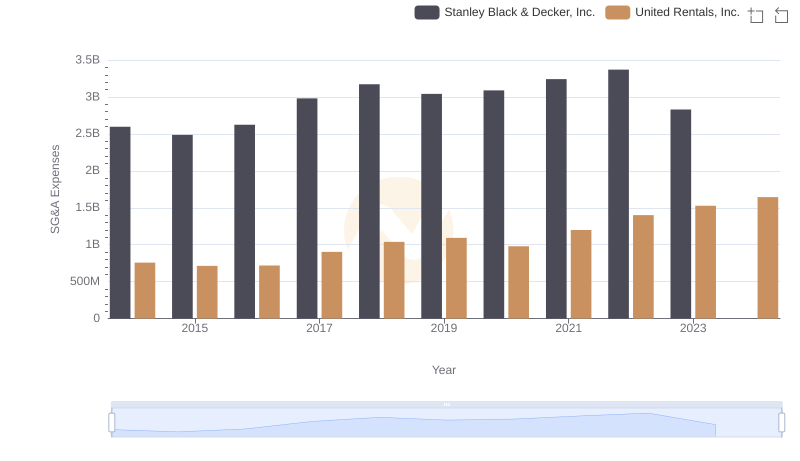
Cost Management Insights: SG&A Expenses for United Rentals, Inc. and Stanley Black & Decker, Inc.
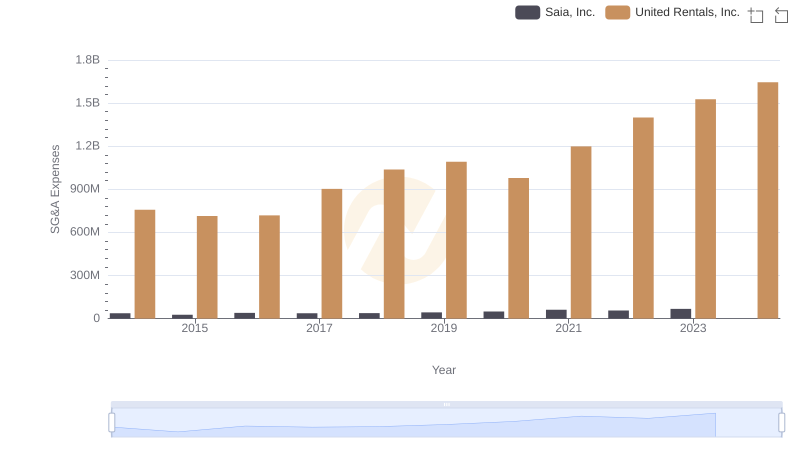
Breaking Down SG&A Expenses: United Rentals, Inc. vs Saia, Inc.
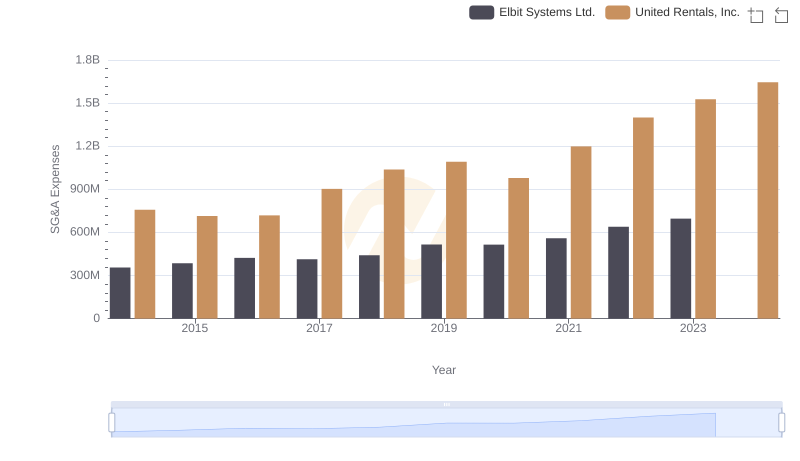
Operational Costs Compared: SG&A Analysis of United Rentals, Inc. and Elbit Systems Ltd.
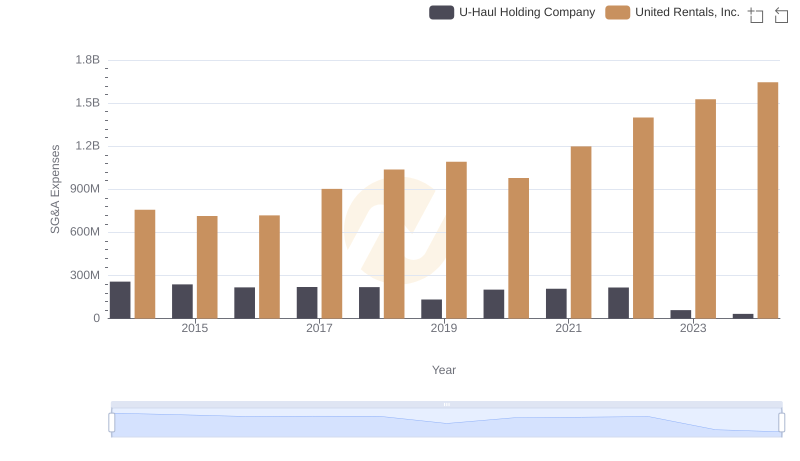
Comparing SG&A Expenses: United Rentals, Inc. vs U-Haul Holding Company Trends and Insights
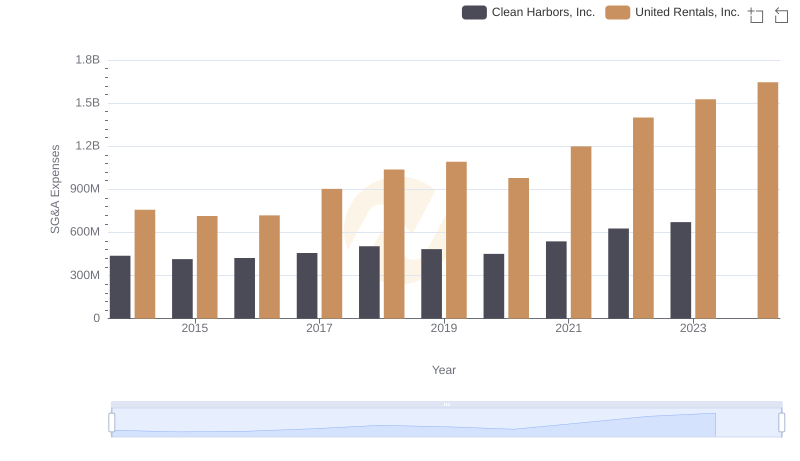
Operational Costs Compared: SG&A Analysis of United Rentals, Inc. and Clean Harbors, Inc.
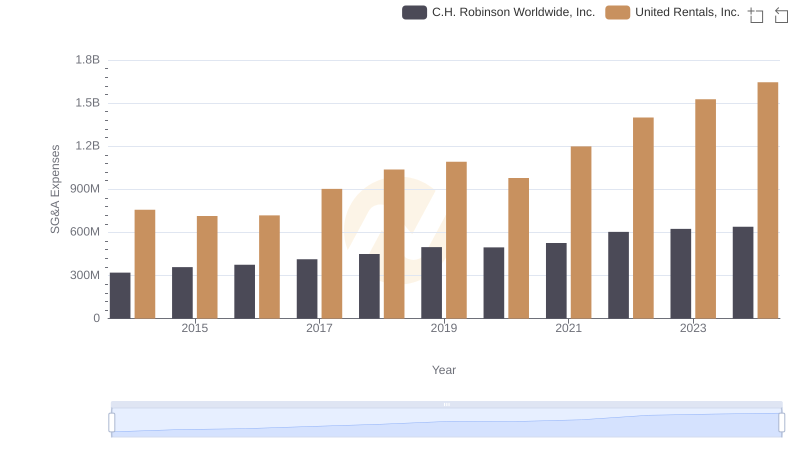
United Rentals, Inc. and C.H. Robinson Worldwide, Inc.: SG&A Spending Patterns Compared
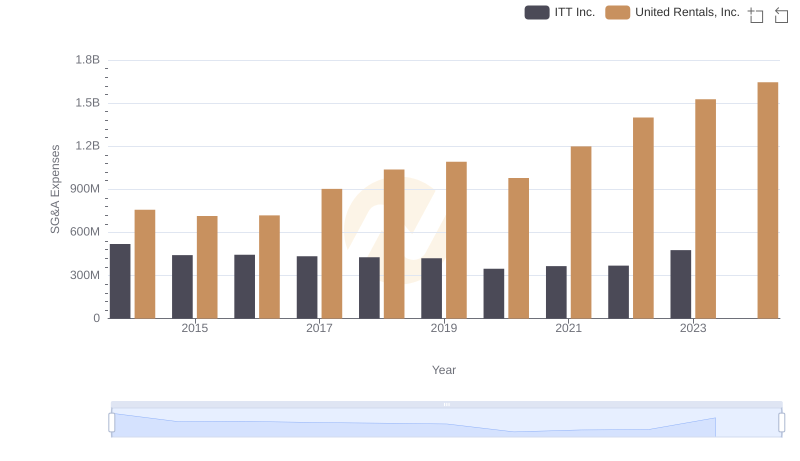
SG&A Efficiency Analysis: Comparing United Rentals, Inc. and ITT Inc.
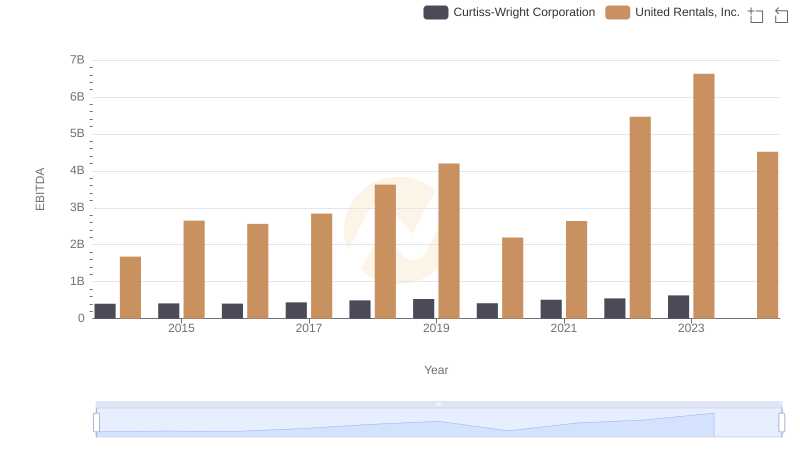
Comparative EBITDA Analysis: United Rentals, Inc. vs Curtiss-Wright Corporation