| __timestamp | Trane Technologies plc | TransDigm Group Incorporated |
|---|---|---|
| Wednesday, January 1, 2014 | 2503900000 | 276446000 |
| Thursday, January 1, 2015 | 2541100000 | 321624000 |
| Friday, January 1, 2016 | 2606500000 | 382858000 |
| Sunday, January 1, 2017 | 2720700000 | 415575000 |
| Monday, January 1, 2018 | 2903200000 | 450095000 |
| Tuesday, January 1, 2019 | 3129800000 | 747773000 |
| Wednesday, January 1, 2020 | 2270600000 | 727000000 |
| Friday, January 1, 2021 | 2446300000 | 685000000 |
| Saturday, January 1, 2022 | 2545900000 | 748000000 |
| Sunday, January 1, 2023 | 2963200000 | 780000000 |
| Monday, January 1, 2024 | 3580400000 | 931000000 |
Unveiling the hidden dimensions of data
In the competitive landscape of industrial manufacturing, Trane Technologies plc and TransDigm Group Incorporated have showcased distinct trends in their Selling, General, and Administrative (SG&A) expenses over the past decade. From 2014 to 2023, Trane Technologies consistently allocated a significant portion of its budget to SG&A, peaking in 2019 with a 25% increase from 2014. However, a notable dip occurred in 2020, reflecting broader economic challenges.
Conversely, TransDigm Group's SG&A expenses have steadily climbed, with a remarkable 236% increase from 2014 to 2023. This growth trajectory underscores TransDigm's strategic investments in administrative capabilities and market expansion. Interestingly, while Trane's data for 2024 remains unavailable, TransDigm's continued upward trend suggests a robust commitment to operational excellence.
These patterns highlight the strategic priorities of each company, offering insights into their financial health and market strategies.
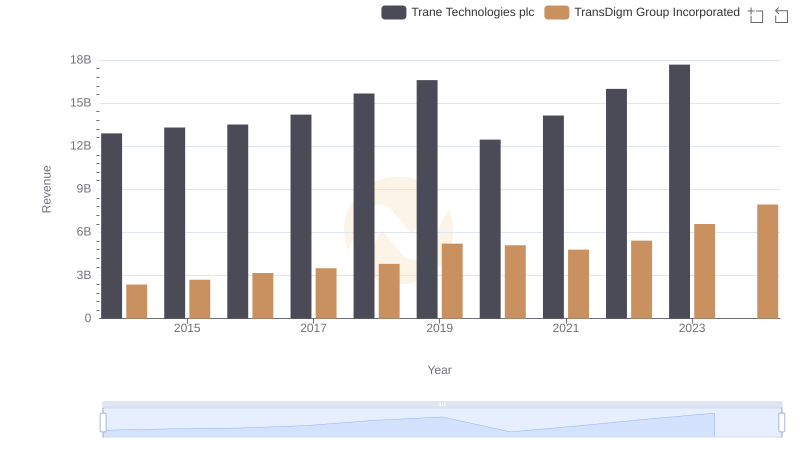
Trane Technologies plc vs TransDigm Group Incorporated: Annual Revenue Growth Compared
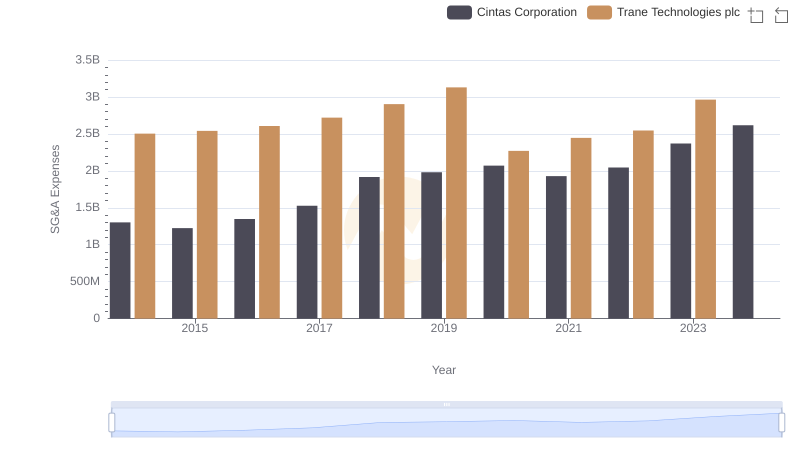
Trane Technologies plc vs Cintas Corporation: SG&A Expense Trends
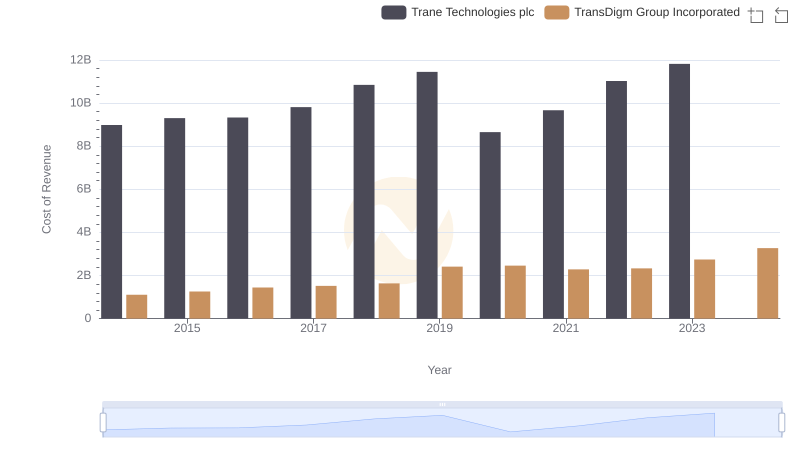
Comparing Cost of Revenue Efficiency: Trane Technologies plc vs TransDigm Group Incorporated
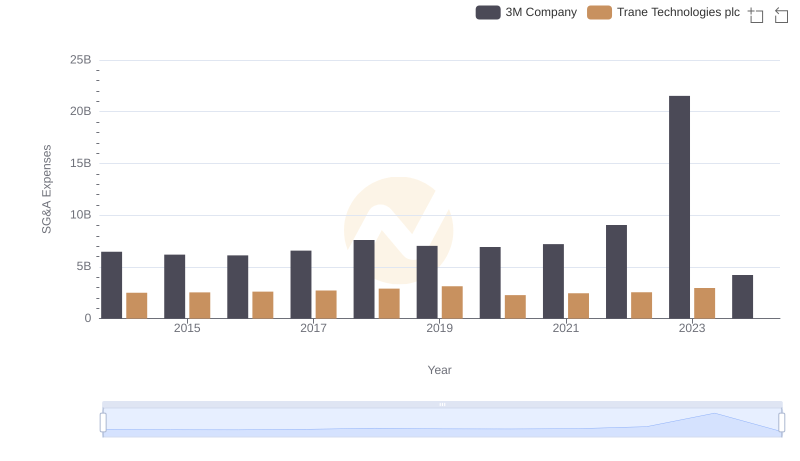
Breaking Down SG&A Expenses: Trane Technologies plc vs 3M Company
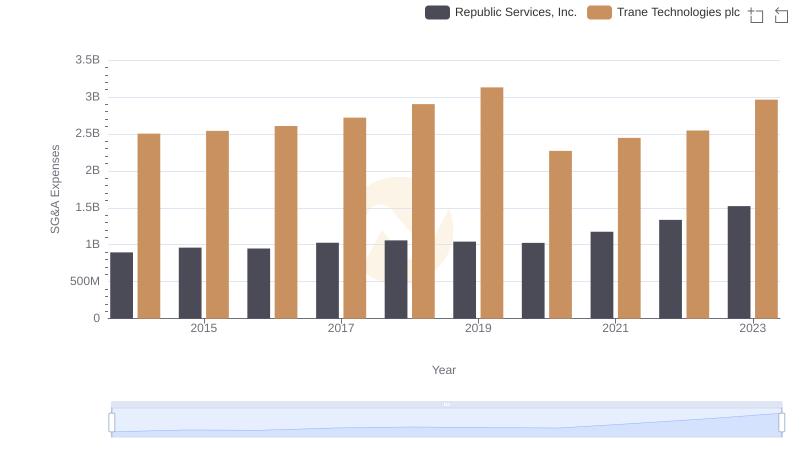
Cost Management Insights: SG&A Expenses for Trane Technologies plc and Republic Services, Inc.
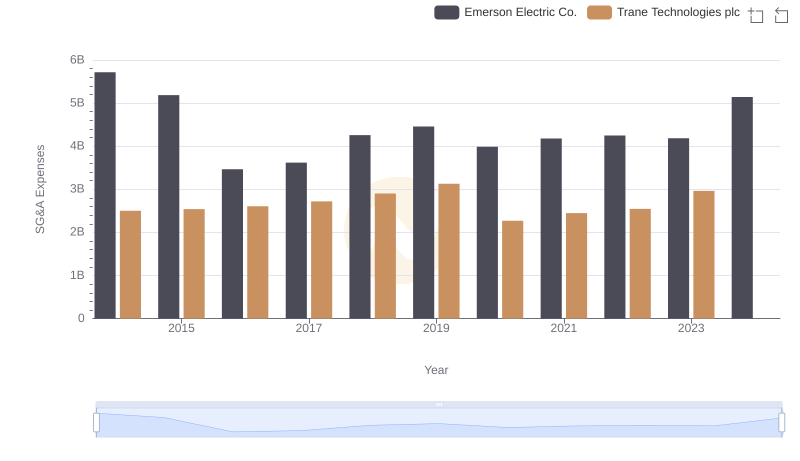
Operational Costs Compared: SG&A Analysis of Trane Technologies plc and Emerson Electric Co.
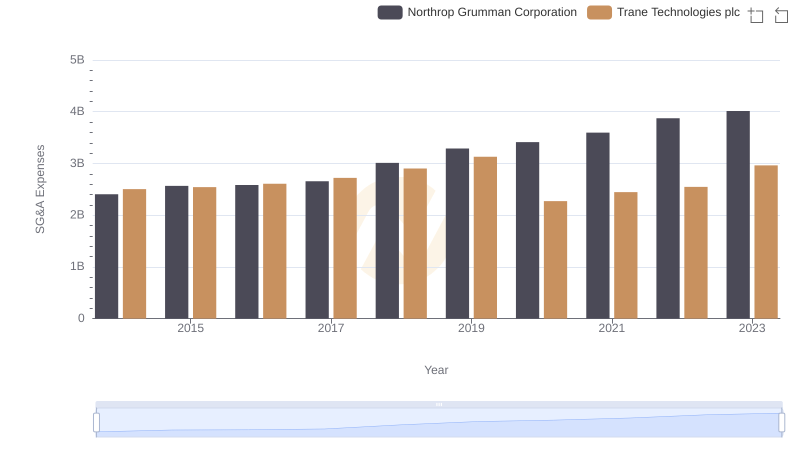
Trane Technologies plc vs Northrop Grumman Corporation: SG&A Expense Trends