| __timestamp | 3M Company | Trane Technologies plc |
|---|---|---|
| Wednesday, January 1, 2014 | 6469000000 | 2503900000 |
| Thursday, January 1, 2015 | 6182000000 | 2541100000 |
| Friday, January 1, 2016 | 6111000000 | 2606500000 |
| Sunday, January 1, 2017 | 6572000000 | 2720700000 |
| Monday, January 1, 2018 | 7602000000 | 2903200000 |
| Tuesday, January 1, 2019 | 7029000000 | 3129800000 |
| Wednesday, January 1, 2020 | 6929000000 | 2270600000 |
| Friday, January 1, 2021 | 7197000000 | 2446300000 |
| Saturday, January 1, 2022 | 9049000000 | 2545900000 |
| Sunday, January 1, 2023 | 21526000000 | 2963200000 |
| Monday, January 1, 2024 | 4221000000 | 3580400000 |
Data in motion
In the ever-evolving landscape of industrial giants, understanding the financial dynamics of companies like Trane Technologies and 3M is crucial. Over the past decade, 3M has consistently outpaced Trane Technologies in Selling, General, and Administrative (SG&A) expenses. Notably, in 2023, 3M's SG&A expenses surged to a staggering 21.5 billion, marking a significant increase from previous years. In contrast, Trane Technologies maintained a more stable trajectory, with expenses peaking at approximately 3.1 billion in 2019 before experiencing fluctuations.
From 2014 to 2023, 3M's SG&A expenses grew by nearly 233%, while Trane Technologies saw a more modest increase of around 18%. This disparity highlights 3M's expansive operational scale and strategic investments. However, the data for 2024 shows a notable absence for Trane Technologies, indicating potential shifts or reporting changes. As these industry leaders navigate future challenges, their financial strategies will undoubtedly shape their competitive edge.
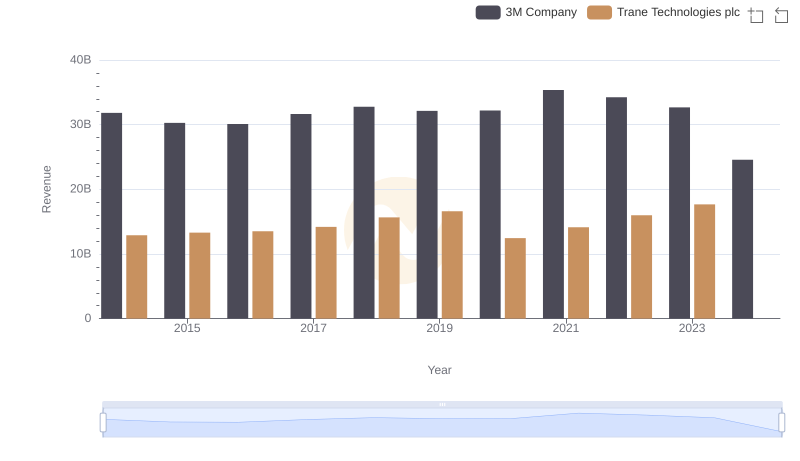
Annual Revenue Comparison: Trane Technologies plc vs 3M Company
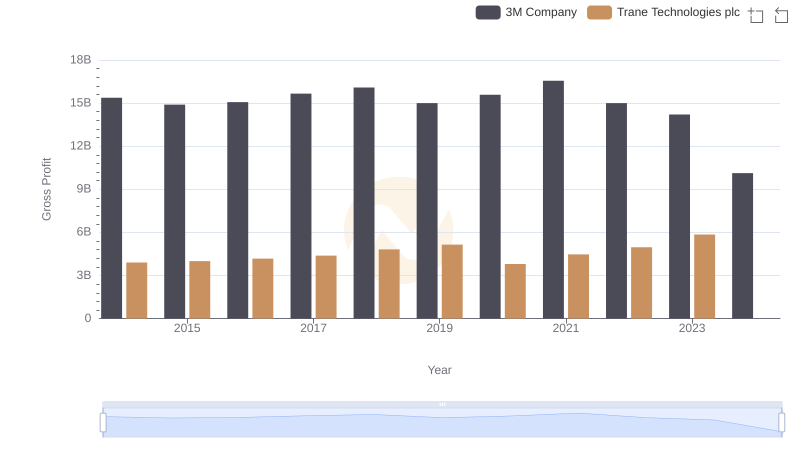
Who Generates Higher Gross Profit? Trane Technologies plc or 3M Company
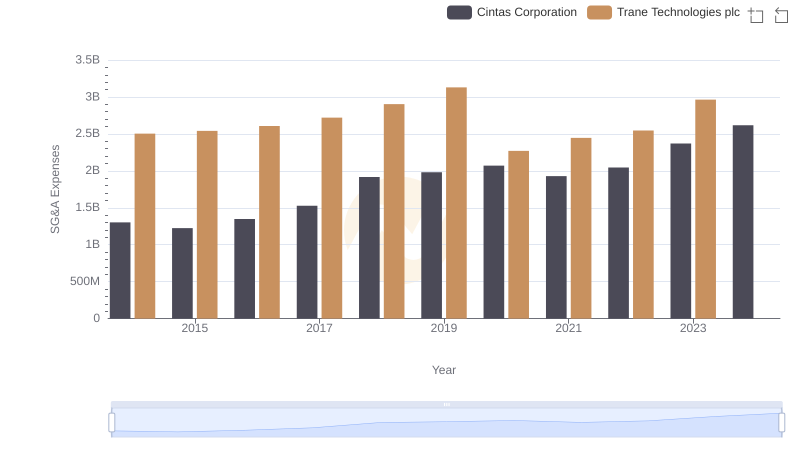
Trane Technologies plc vs Cintas Corporation: SG&A Expense Trends
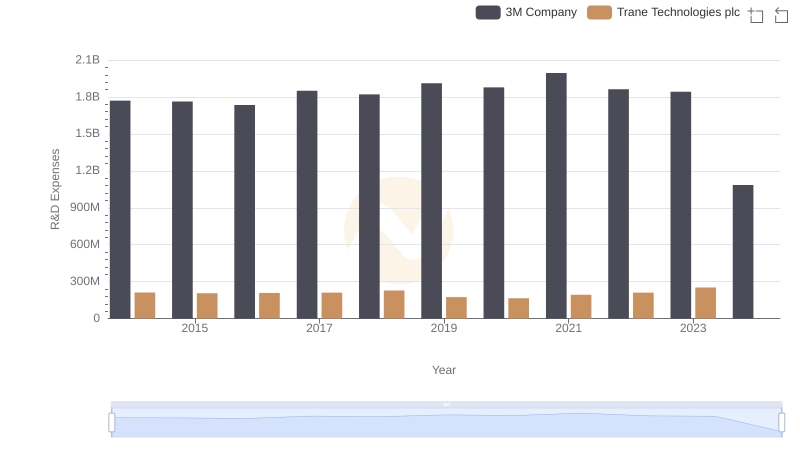
Trane Technologies plc or 3M Company: Who Invests More in Innovation?
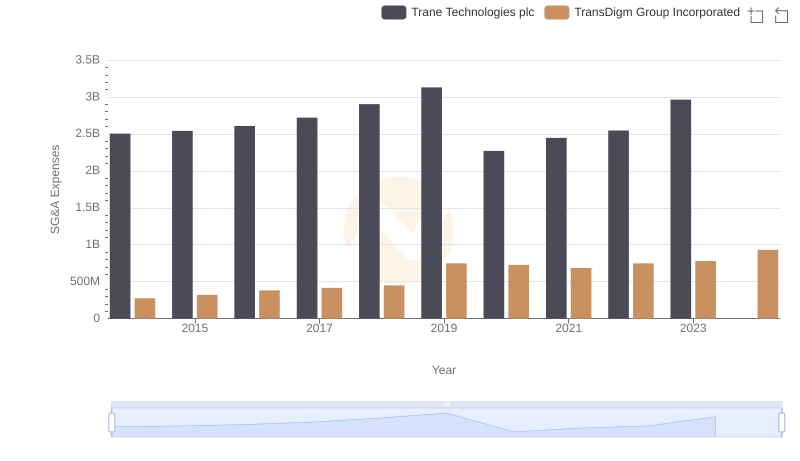
Trane Technologies plc and TransDigm Group Incorporated: SG&A Spending Patterns Compared
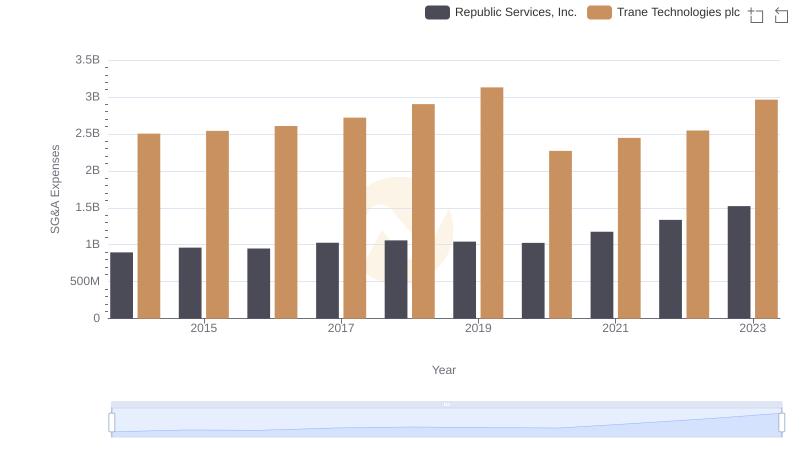
Cost Management Insights: SG&A Expenses for Trane Technologies plc and Republic Services, Inc.
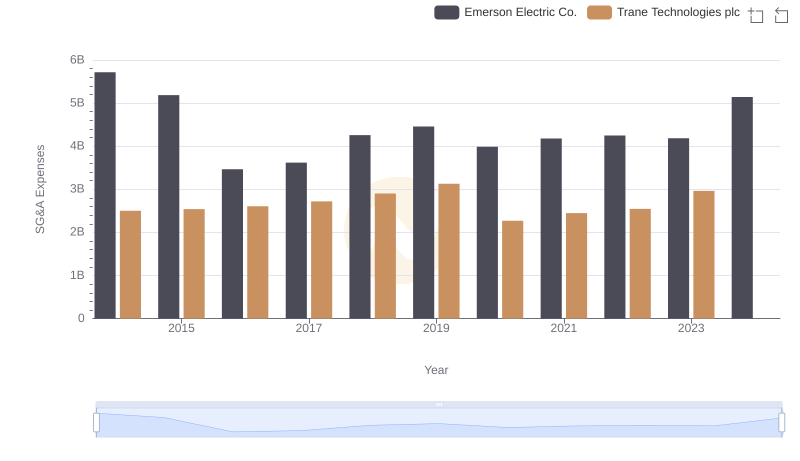
Operational Costs Compared: SG&A Analysis of Trane Technologies plc and Emerson Electric Co.
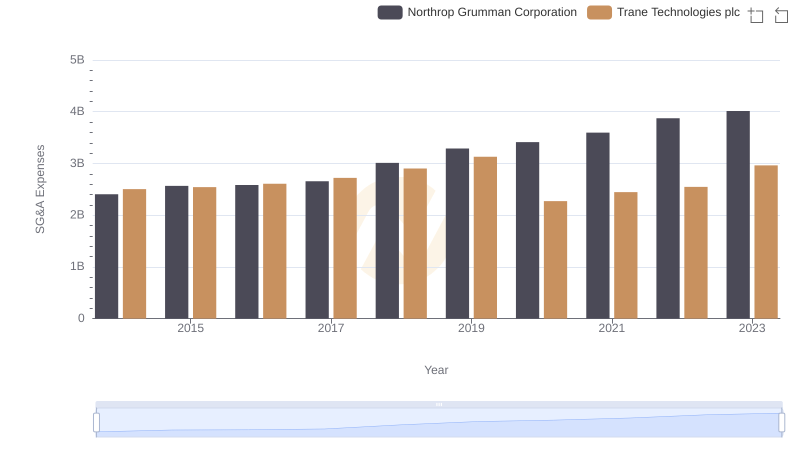
Trane Technologies plc vs Northrop Grumman Corporation: SG&A Expense Trends