| __timestamp | Cintas Corporation | Stanley Black & Decker, Inc. |
|---|---|---|
| Wednesday, January 1, 2014 | 2637426000 | 7235900000 |
| Thursday, January 1, 2015 | 2555549000 | 7099800000 |
| Friday, January 1, 2016 | 2775588000 | 7139700000 |
| Sunday, January 1, 2017 | 2943086000 | 7969200000 |
| Monday, January 1, 2018 | 3568109000 | 9080500000 |
| Tuesday, January 1, 2019 | 3763715000 | 9636700000 |
| Wednesday, January 1, 2020 | 3851372000 | 9566700000 |
| Friday, January 1, 2021 | 3801689000 | 10423000000 |
| Saturday, January 1, 2022 | 4222213000 | 12663300000 |
| Sunday, January 1, 2023 | 4642401000 | 11683100000 |
| Monday, January 1, 2024 | 4910199000 | 10851300000 |
Infusing magic into the data realm
In the ever-evolving landscape of corporate finance, understanding the cost of revenue is crucial for evaluating a company's efficiency and profitability. Over the past decade, Cintas Corporation and Stanley Black & Decker, Inc. have demonstrated distinct trajectories in their cost of revenue. From 2014 to 2023, Cintas Corporation saw a steady increase, with costs rising approximately 86%, reflecting their strategic growth and expansion. In contrast, Stanley Black & Decker, Inc. experienced a more volatile path, peaking in 2022 with a 75% increase from 2014, before a slight decline in 2023. This fluctuation may indicate challenges in managing production costs or shifts in market demand. Notably, data for 2024 is incomplete, highlighting the need for ongoing analysis. These insights provide a window into the operational strategies of these industry giants, offering valuable lessons for investors and business leaders alike.
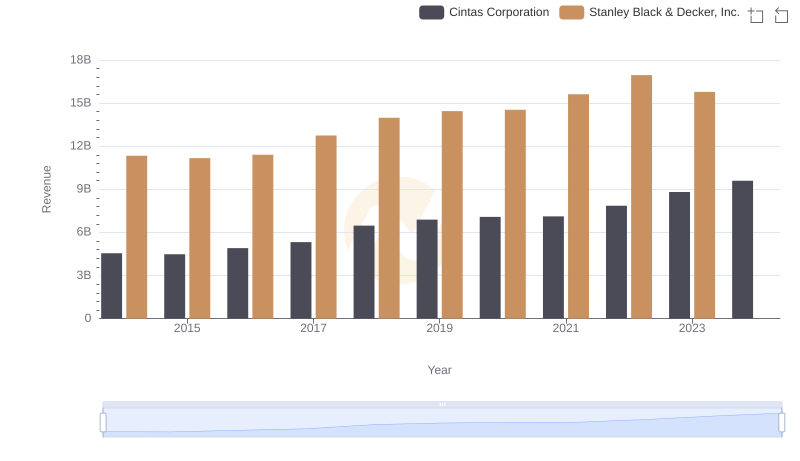
Cintas Corporation or Stanley Black & Decker, Inc.: Who Leads in Yearly Revenue?
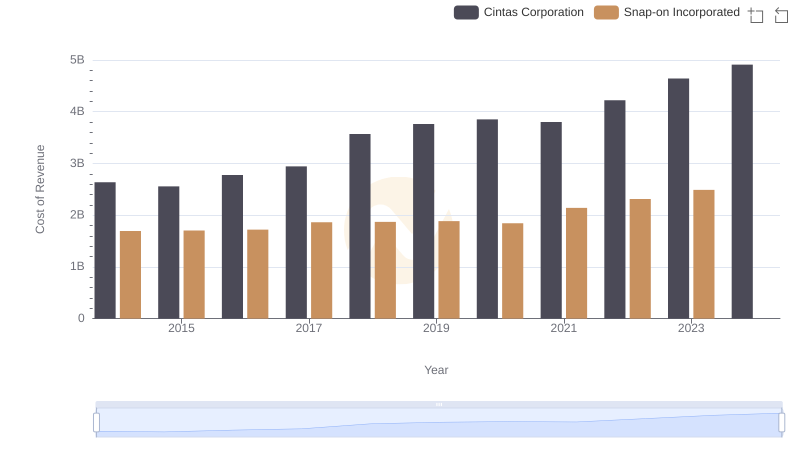
Analyzing Cost of Revenue: Cintas Corporation and Snap-on Incorporated
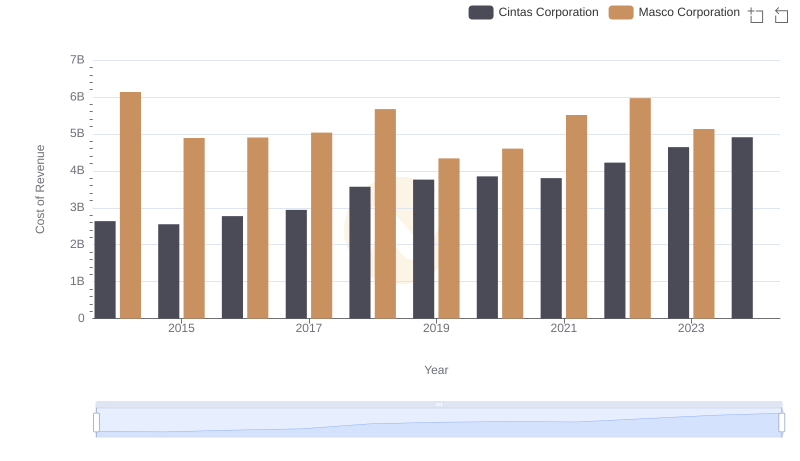
Comparing Cost of Revenue Efficiency: Cintas Corporation vs Masco Corporation

Key Insights on Gross Profit: Cintas Corporation vs Stanley Black & Decker, Inc.
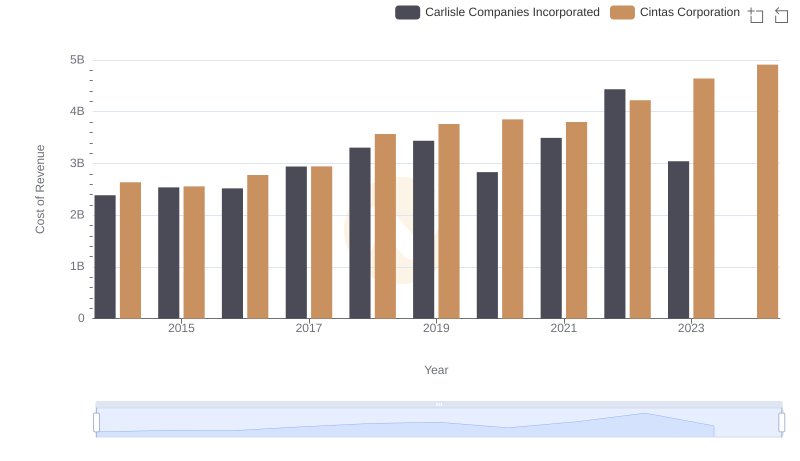
Cost of Revenue: Key Insights for Cintas Corporation and Carlisle Companies Incorporated

Operational Costs Compared: SG&A Analysis of Cintas Corporation and Stanley Black & Decker, Inc.
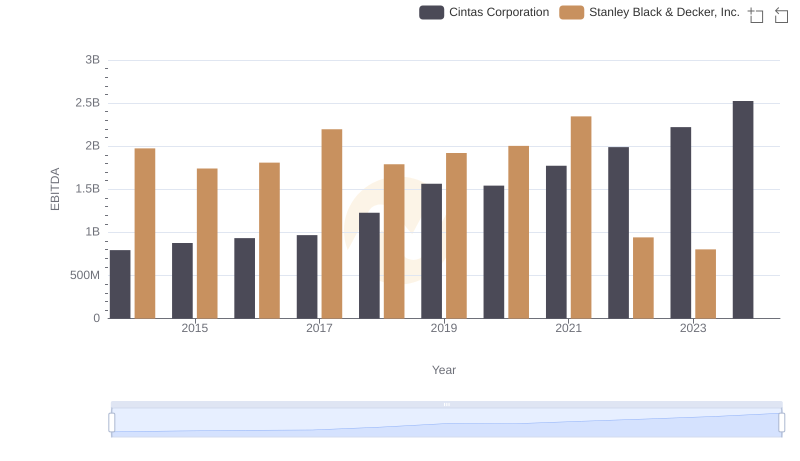
Cintas Corporation vs Stanley Black & Decker, Inc.: In-Depth EBITDA Performance Comparison

Breaking Down Revenue Trends: Cintas Corporation vs Stanley Black & Decker, Inc.
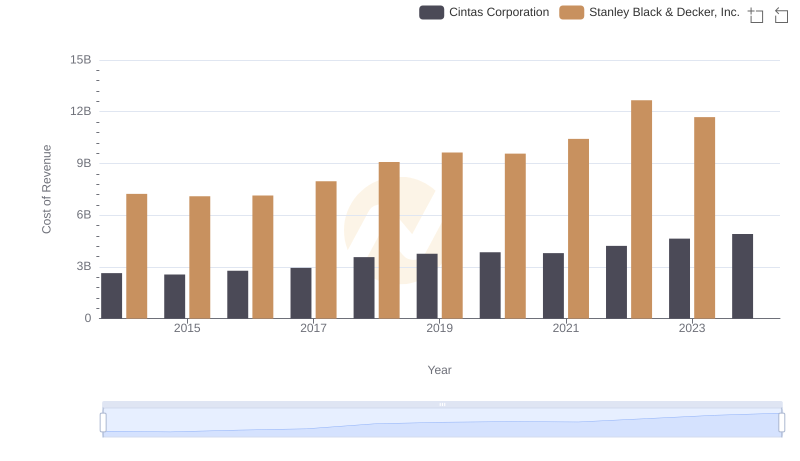
Analyzing Cost of Revenue: Cintas Corporation and Stanley Black & Decker, Inc.
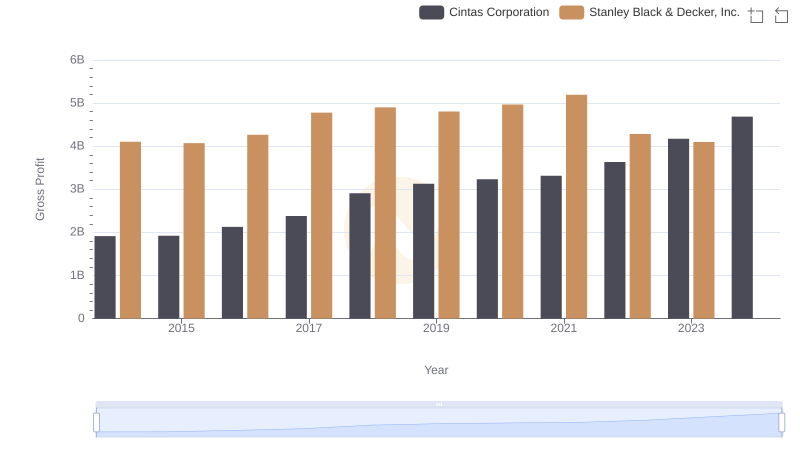
Key Insights on Gross Profit: Cintas Corporation vs Stanley Black & Decker, Inc.
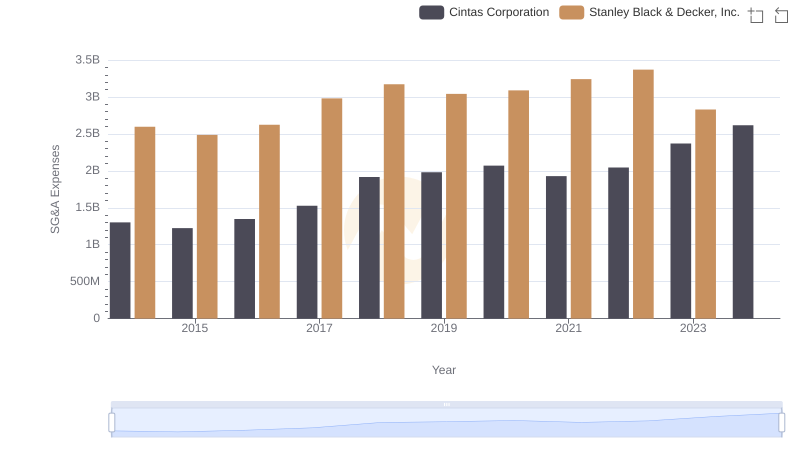
Cintas Corporation or Stanley Black & Decker, Inc.: Who Manages SG&A Costs Better?

Comprehensive EBITDA Comparison: Cintas Corporation vs Stanley Black & Decker, Inc.