| __timestamp | Cintas Corporation | IDEX Corporation |
|---|---|---|
| Wednesday, January 1, 2014 | 1302752000 | 504419000 |
| Thursday, January 1, 2015 | 1224930000 | 479408000 |
| Friday, January 1, 2016 | 1348122000 | 498994000 |
| Sunday, January 1, 2017 | 1527380000 | 524940000 |
| Monday, January 1, 2018 | 1916792000 | 536724000 |
| Tuesday, January 1, 2019 | 1980644000 | 524987000 |
| Wednesday, January 1, 2020 | 2071052000 | 494935000 |
| Friday, January 1, 2021 | 1929159000 | 578200000 |
| Saturday, January 1, 2022 | 2044876000 | 652700000 |
| Sunday, January 1, 2023 | 2370704000 | 703500000 |
| Monday, January 1, 2024 | 2617783000 | 758700000 |
Unleashing the power of data
In the ever-evolving landscape of corporate finance, understanding operational costs is crucial. Over the past decade, Cintas Corporation and IDEX Corporation have showcased distinct trajectories in their Selling, General, and Administrative (SG&A) expenses. From 2014 to 2023, Cintas has seen a remarkable 100% increase in SG&A expenses, peaking in 2023. This growth reflects strategic investments and expansion efforts. In contrast, IDEX Corporation's SG&A expenses have grown by approximately 40% over the same period, indicating a more conservative approach. Notably, Cintas's expenses consistently outpaced IDEX's, highlighting differing operational strategies. The data for 2024 is incomplete, with IDEX's figures missing, suggesting a need for further analysis. These insights provide a window into the financial strategies of two industry leaders, offering valuable lessons for investors and analysts alike.
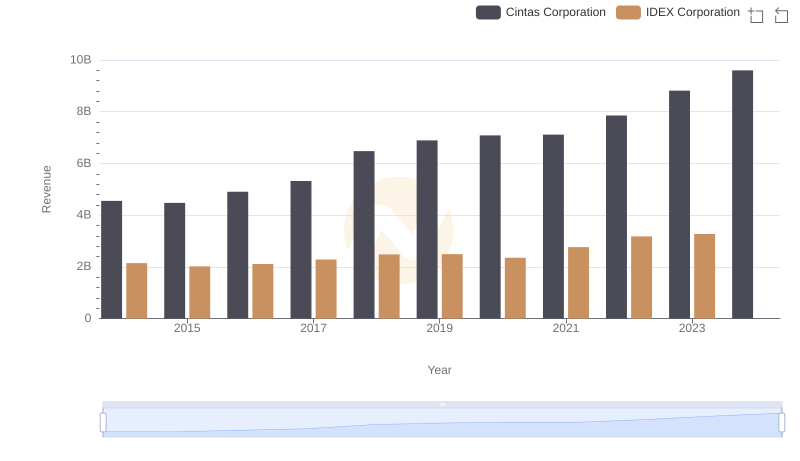
Comparing Revenue Performance: Cintas Corporation or IDEX Corporation?
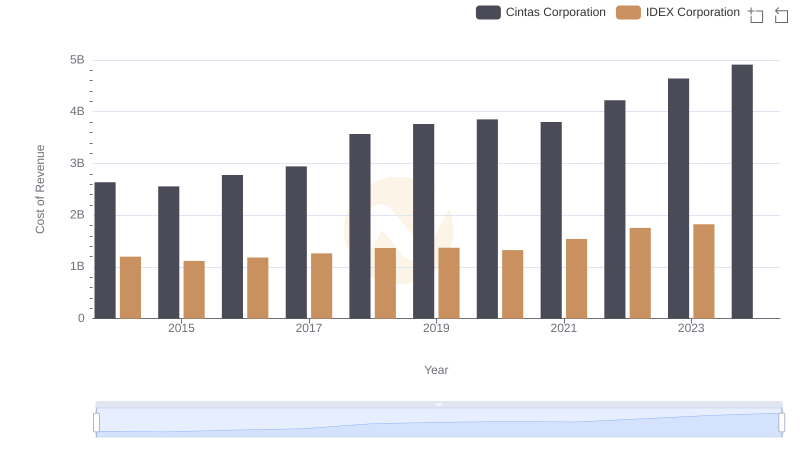
Cintas Corporation vs IDEX Corporation: Efficiency in Cost of Revenue Explored
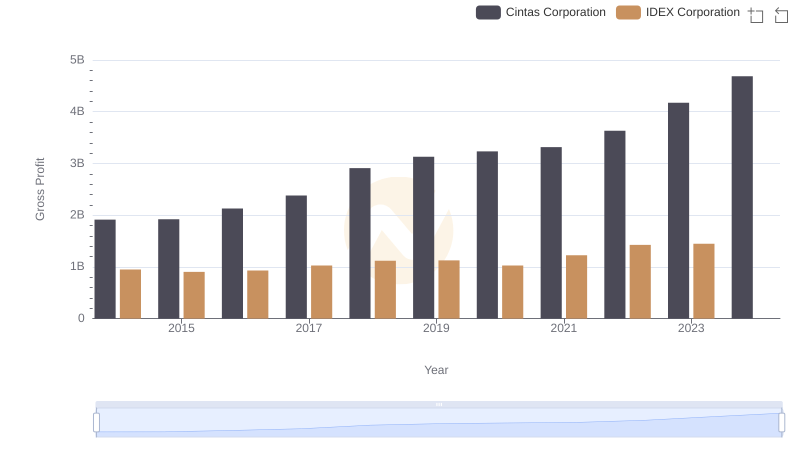
Gross Profit Trends Compared: Cintas Corporation vs IDEX Corporation
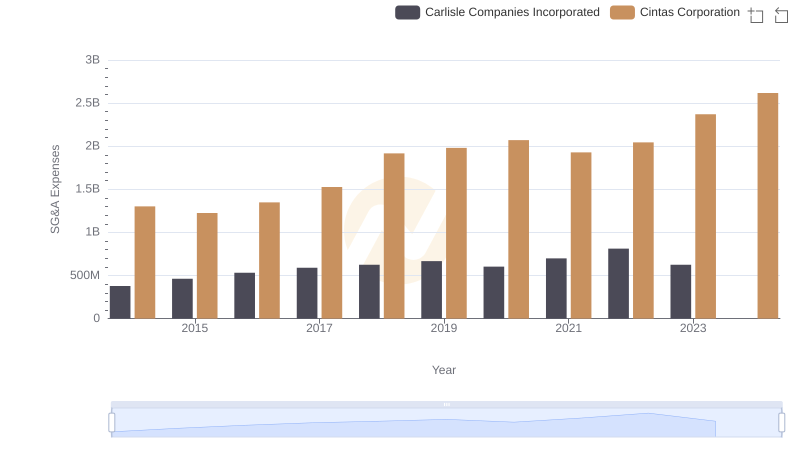
Who Optimizes SG&A Costs Better? Cintas Corporation or Carlisle Companies Incorporated
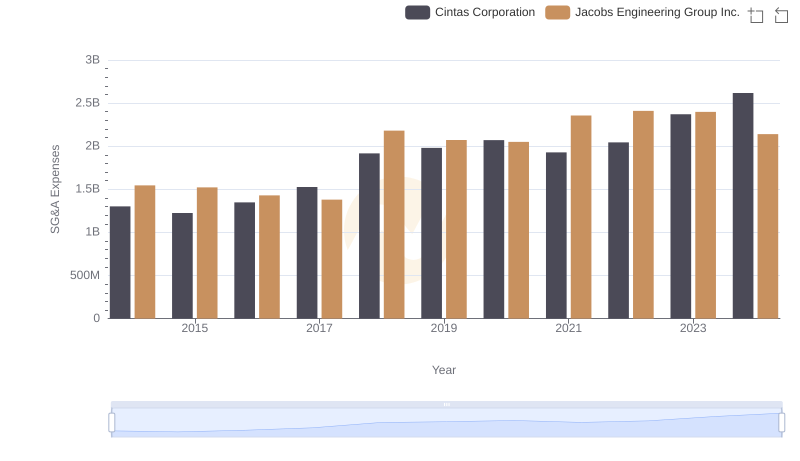
Cost Management Insights: SG&A Expenses for Cintas Corporation and Jacobs Engineering Group Inc.
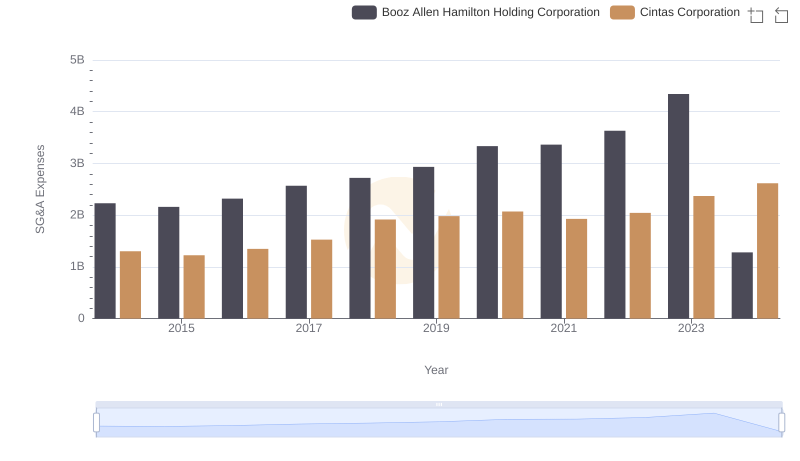
Cintas Corporation and Booz Allen Hamilton Holding Corporation: SG&A Spending Patterns Compared
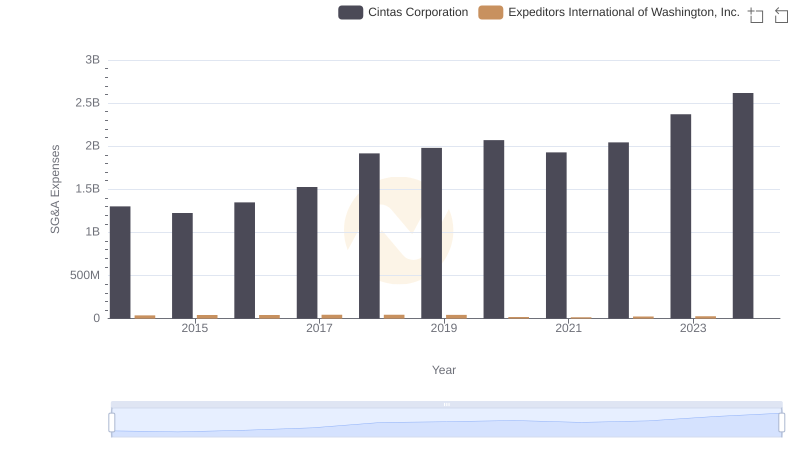
Operational Costs Compared: SG&A Analysis of Cintas Corporation and Expeditors International of Washington, Inc.
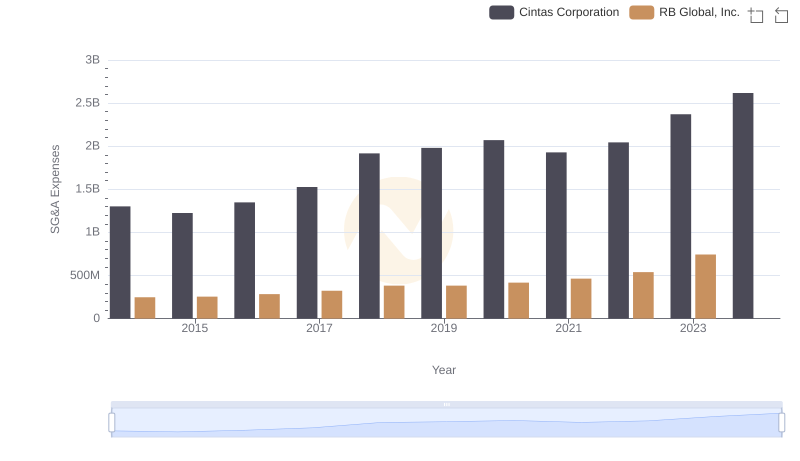
Cintas Corporation and RB Global, Inc.: SG&A Spending Patterns Compared
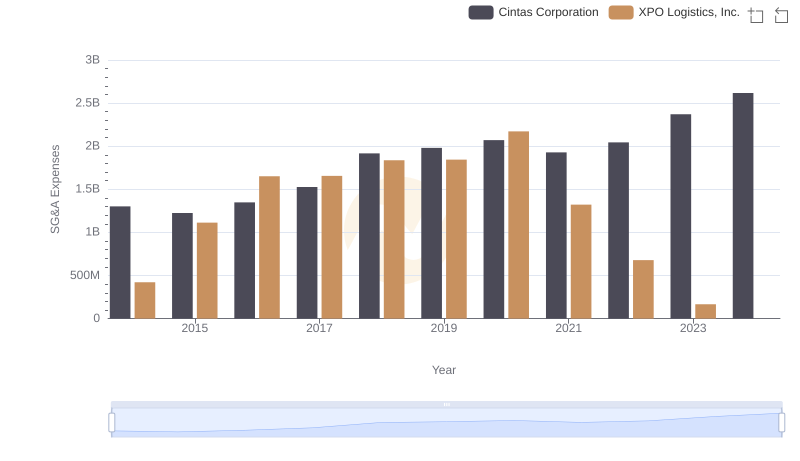
SG&A Efficiency Analysis: Comparing Cintas Corporation and XPO Logistics, Inc.
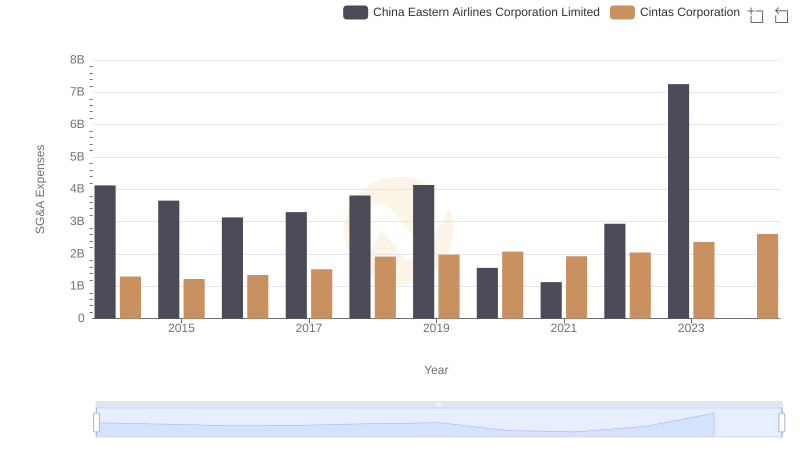
Cintas Corporation and China Eastern Airlines Corporation Limited: SG&A Spending Patterns Compared
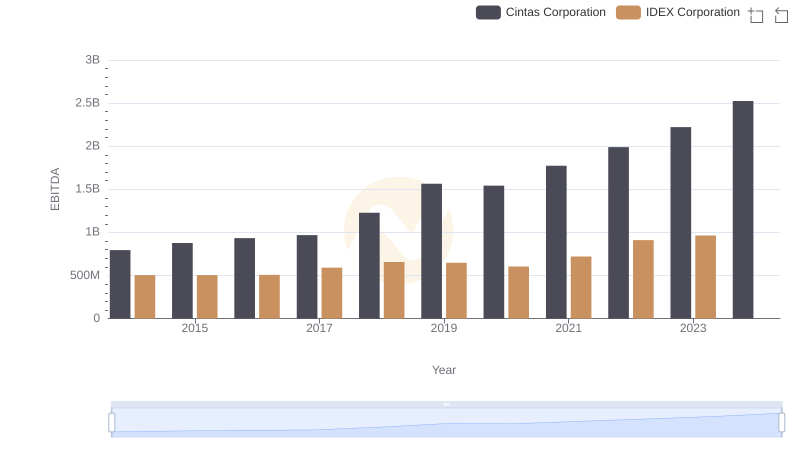
A Side-by-Side Analysis of EBITDA: Cintas Corporation and IDEX Corporation