| __timestamp | Cintas Corporation | IDEX Corporation |
|---|---|---|
| Wednesday, January 1, 2014 | 793811000 | 504019000 |
| Thursday, January 1, 2015 | 877761000 | 505071000 |
| Friday, January 1, 2016 | 933728000 | 507871000 |
| Sunday, January 1, 2017 | 968293000 | 591033000 |
| Monday, January 1, 2018 | 1227852000 | 657092000 |
| Tuesday, January 1, 2019 | 1564228000 | 647793000 |
| Wednesday, January 1, 2020 | 1542737000 | 604602000 |
| Friday, January 1, 2021 | 1773591000 | 720500000 |
| Saturday, January 1, 2022 | 1990046000 | 909800000 |
| Sunday, January 1, 2023 | 2221676000 | 964100000 |
| Monday, January 1, 2024 | 2523857000 | 677200000 |
Unleashing insights
In the ever-evolving landscape of corporate finance, EBITDA serves as a crucial indicator of a company's operational efficiency. Over the past decade, Cintas Corporation has demonstrated a remarkable growth trajectory, with its EBITDA surging by approximately 218% from 2014 to 2023. In contrast, IDEX Corporation, while also showing growth, has experienced a more modest increase of around 91% over the same period.
Cintas's strategic expansions and operational efficiencies have propelled its EBITDA to over 2.5 billion by 2024, a testament to its robust business model. Meanwhile, IDEX's EBITDA reached nearly 964 million by 2023, reflecting steady, albeit slower, growth. Notably, data for IDEX in 2024 is unavailable, highlighting potential gaps in financial reporting.
This side-by-side analysis underscores the dynamic nature of corporate growth and the importance of strategic planning in achieving financial success.
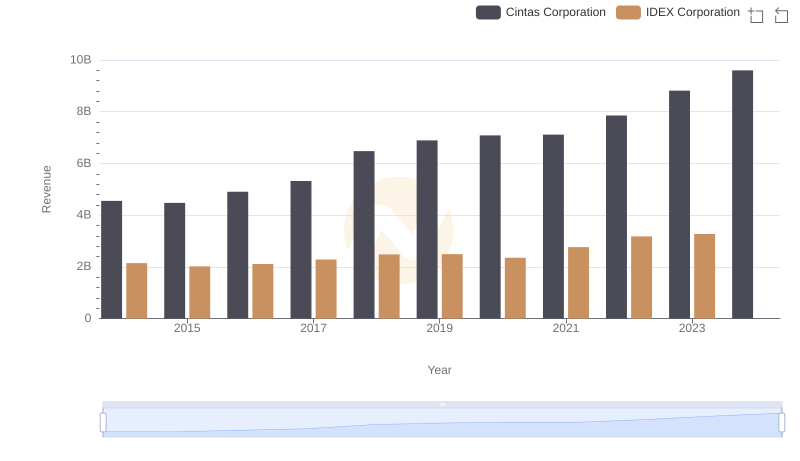
Comparing Revenue Performance: Cintas Corporation or IDEX Corporation?
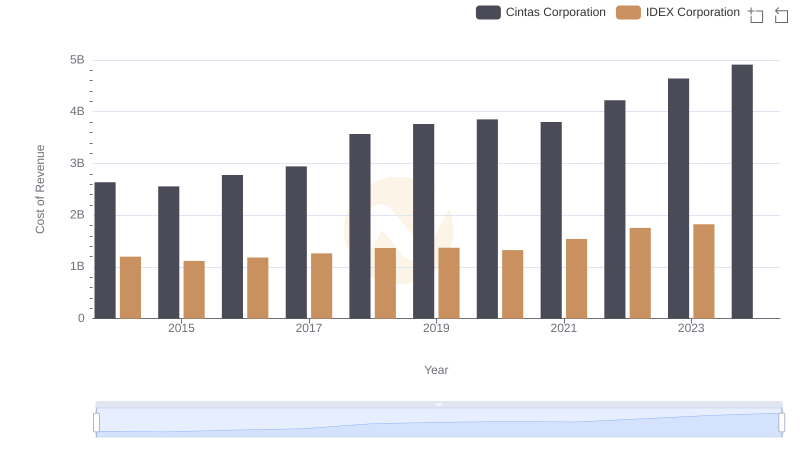
Cintas Corporation vs IDEX Corporation: Efficiency in Cost of Revenue Explored
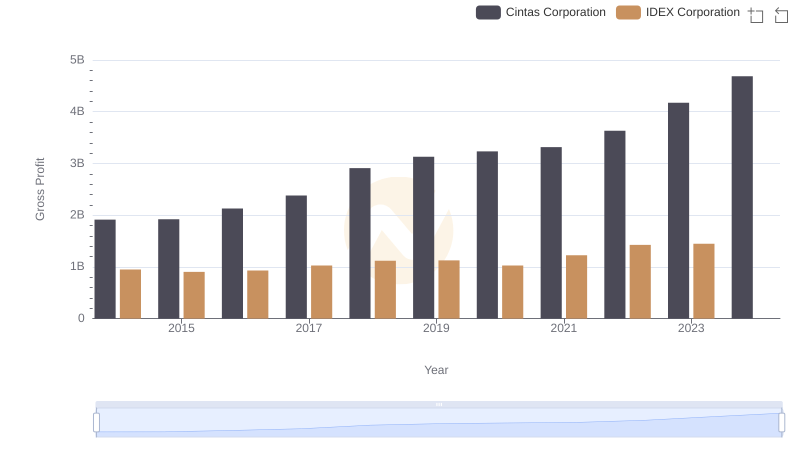
Gross Profit Trends Compared: Cintas Corporation vs IDEX Corporation
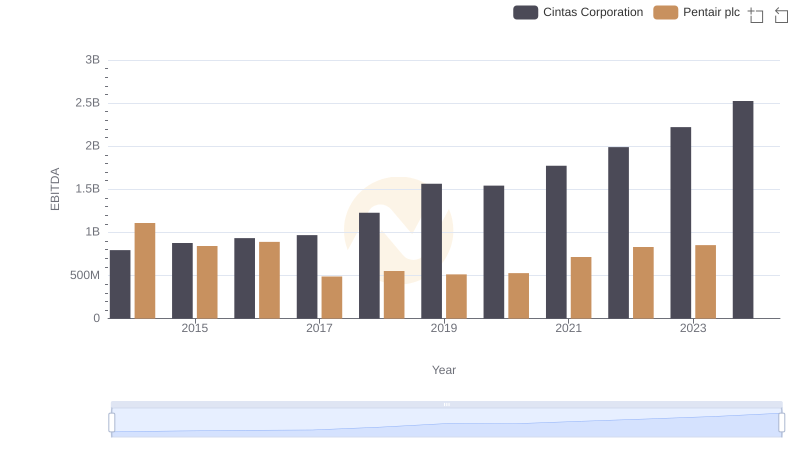
Professional EBITDA Benchmarking: Cintas Corporation vs Pentair plc
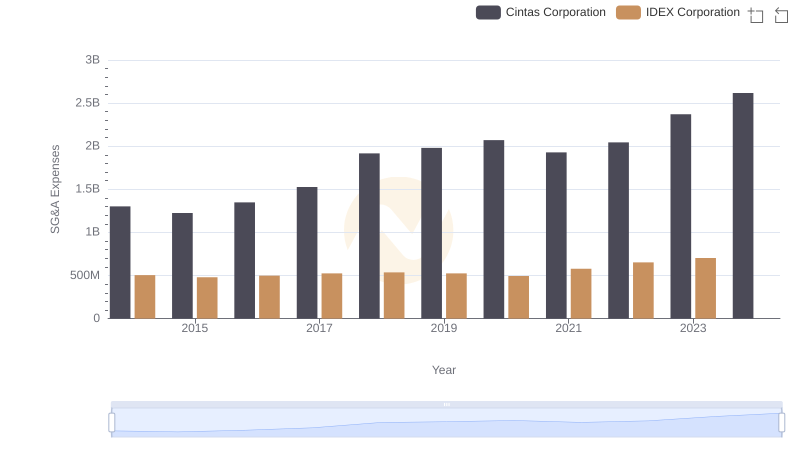
Operational Costs Compared: SG&A Analysis of Cintas Corporation and IDEX Corporation
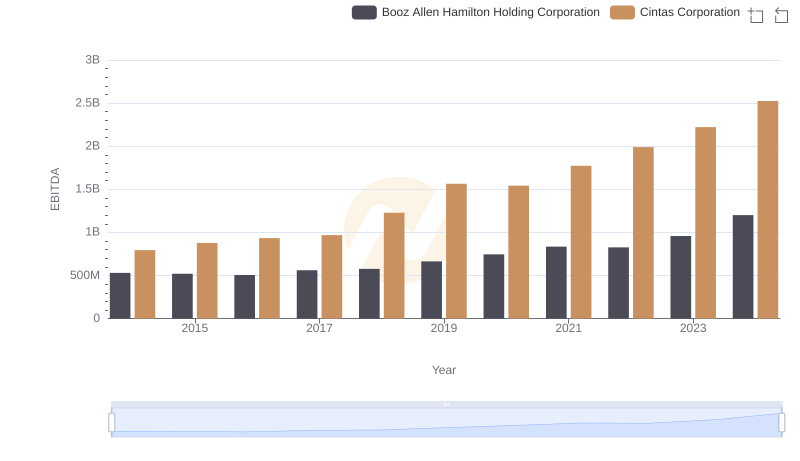
Cintas Corporation and Booz Allen Hamilton Holding Corporation: A Detailed Examination of EBITDA Performance
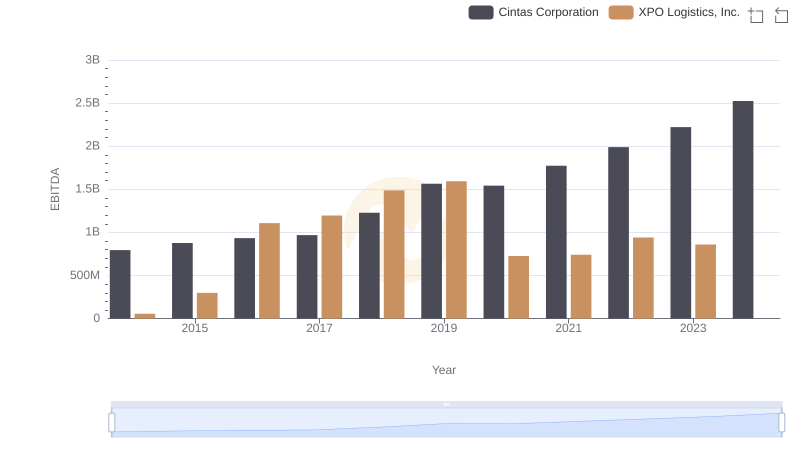
Cintas Corporation and XPO Logistics, Inc.: A Detailed Examination of EBITDA Performance
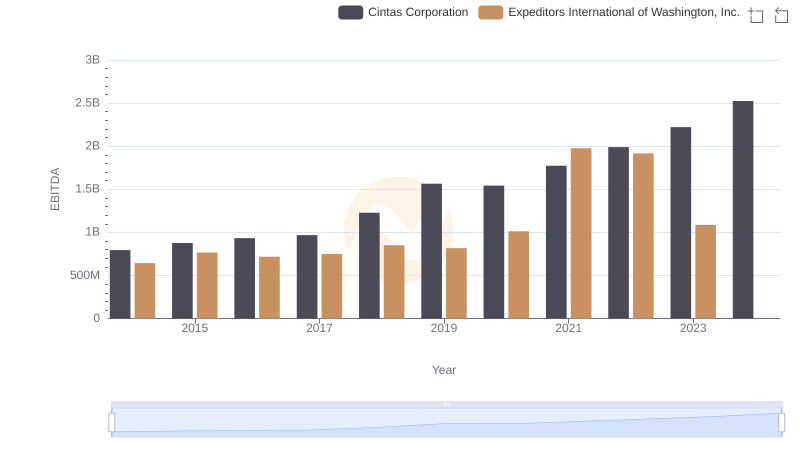
EBITDA Analysis: Evaluating Cintas Corporation Against Expeditors International of Washington, Inc.
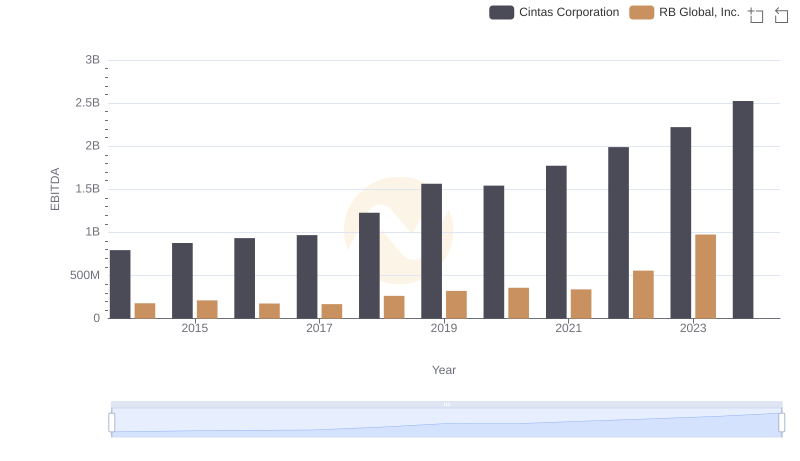
Cintas Corporation and RB Global, Inc.: A Detailed Examination of EBITDA Performance
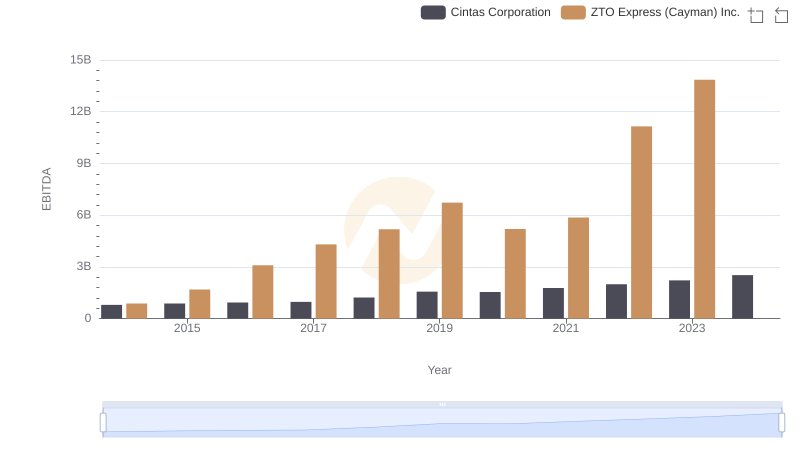
A Side-by-Side Analysis of EBITDA: Cintas Corporation and ZTO Express (Cayman) Inc.