| __timestamp | Cintas Corporation | RB Global, Inc. |
|---|---|---|
| Wednesday, January 1, 2014 | 1302752000 | 248220000 |
| Thursday, January 1, 2015 | 1224930000 | 254990000 |
| Friday, January 1, 2016 | 1348122000 | 283529000 |
| Sunday, January 1, 2017 | 1527380000 | 323270000 |
| Monday, January 1, 2018 | 1916792000 | 382676000 |
| Tuesday, January 1, 2019 | 1980644000 | 382389000 |
| Wednesday, January 1, 2020 | 2071052000 | 417523000 |
| Friday, January 1, 2021 | 1929159000 | 464599000 |
| Saturday, January 1, 2022 | 2044876000 | 539933000 |
| Sunday, January 1, 2023 | 2370704000 | 743700000 |
| Monday, January 1, 2024 | 2617783000 | 773900000 |
Unlocking the unknown
In the world of corporate finance, understanding the nuances of Selling, General, and Administrative (SG&A) expenses is crucial. Over the past decade, Cintas Corporation and RB Global, Inc. have showcased distinct spending patterns. From 2014 to 2023, Cintas Corporation's SG&A expenses surged by approximately 101%, reflecting a strategic expansion and operational scaling. In contrast, RB Global, Inc. exhibited a more modest increase of around 200% during the same period, indicating a steady growth trajectory.
Cintas consistently outpaced RB Global in SG&A spending, with 2023 figures showing Cintas at nearly three times the expenditure of RB Global. However, the data for 2024 is incomplete, leaving room for speculation on future trends. This comparison not only highlights the financial strategies of these companies but also offers insights into their market positioning and operational priorities.
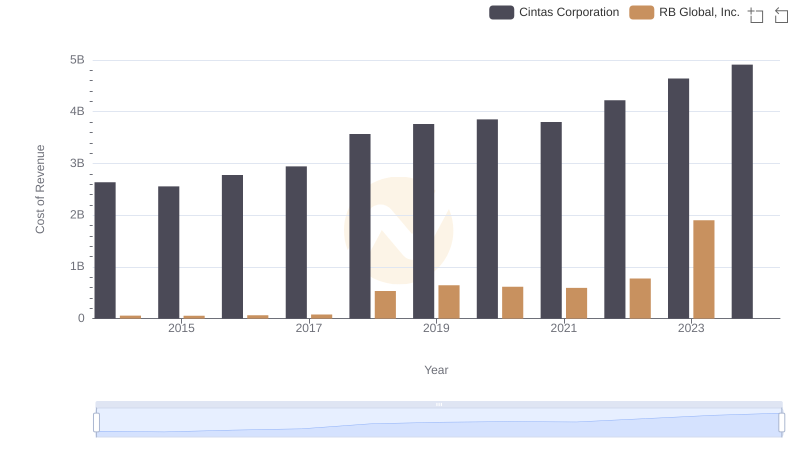
Cintas Corporation vs RB Global, Inc.: Efficiency in Cost of Revenue Explored
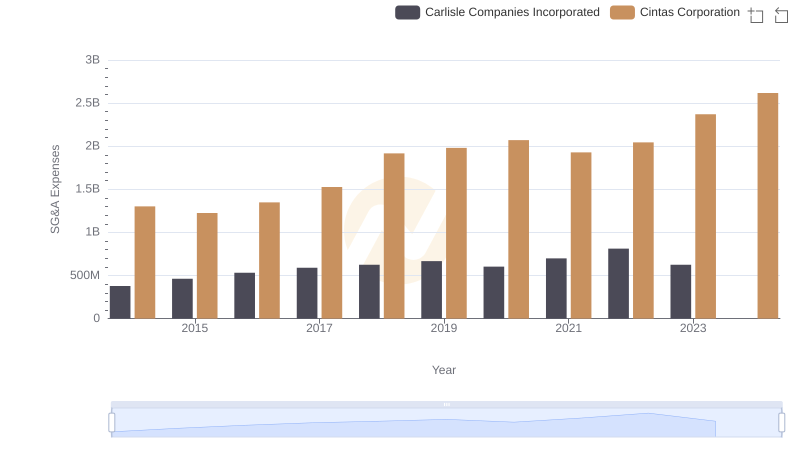
Who Optimizes SG&A Costs Better? Cintas Corporation or Carlisle Companies Incorporated
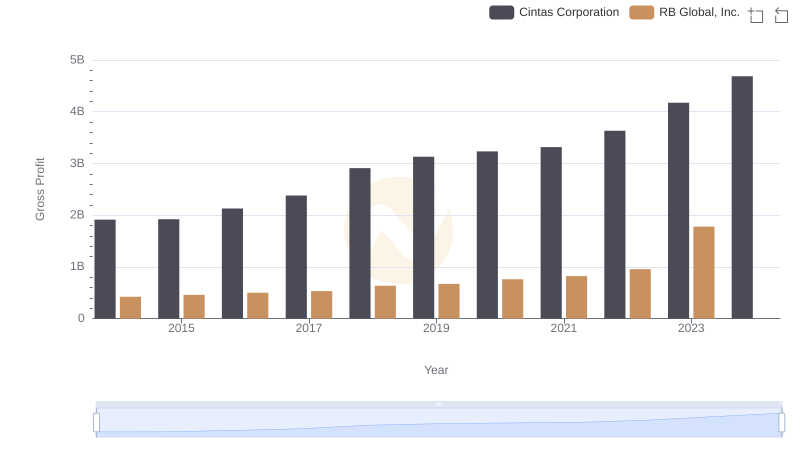
Key Insights on Gross Profit: Cintas Corporation vs RB Global, Inc.
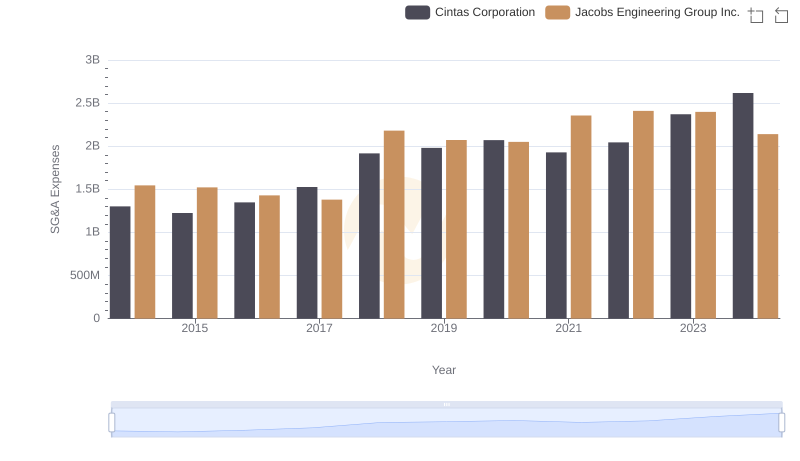
Cost Management Insights: SG&A Expenses for Cintas Corporation and Jacobs Engineering Group Inc.
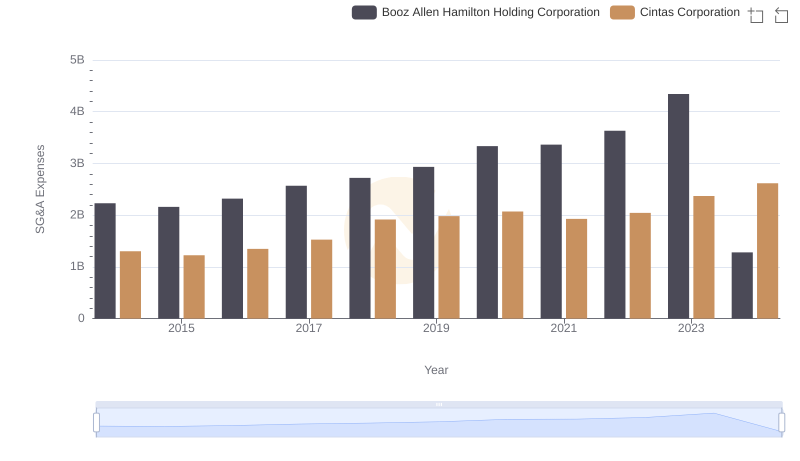
Cintas Corporation and Booz Allen Hamilton Holding Corporation: SG&A Spending Patterns Compared
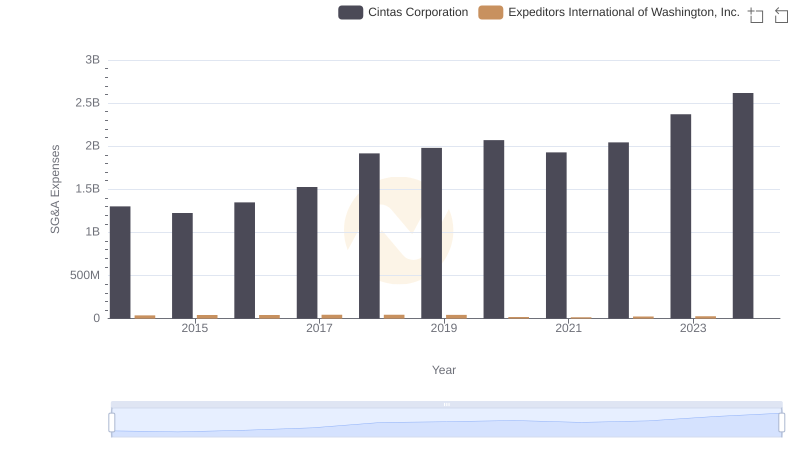
Operational Costs Compared: SG&A Analysis of Cintas Corporation and Expeditors International of Washington, Inc.
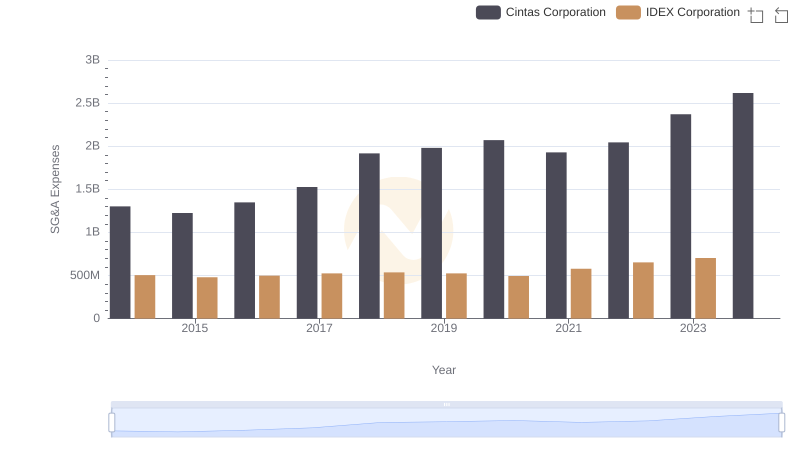
Operational Costs Compared: SG&A Analysis of Cintas Corporation and IDEX Corporation
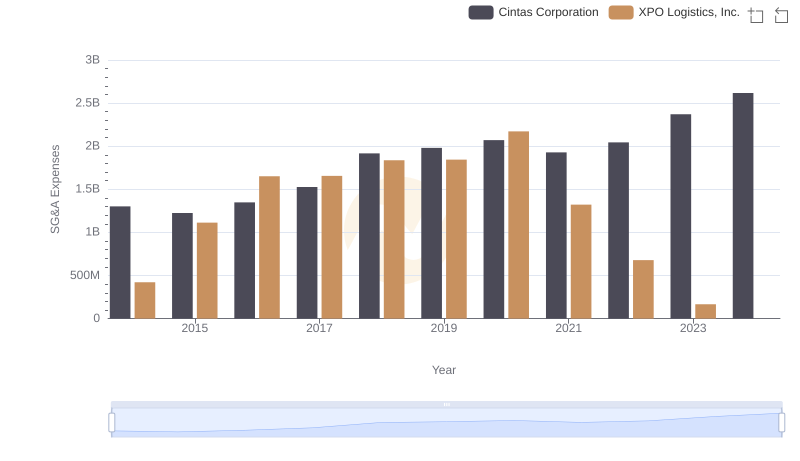
SG&A Efficiency Analysis: Comparing Cintas Corporation and XPO Logistics, Inc.
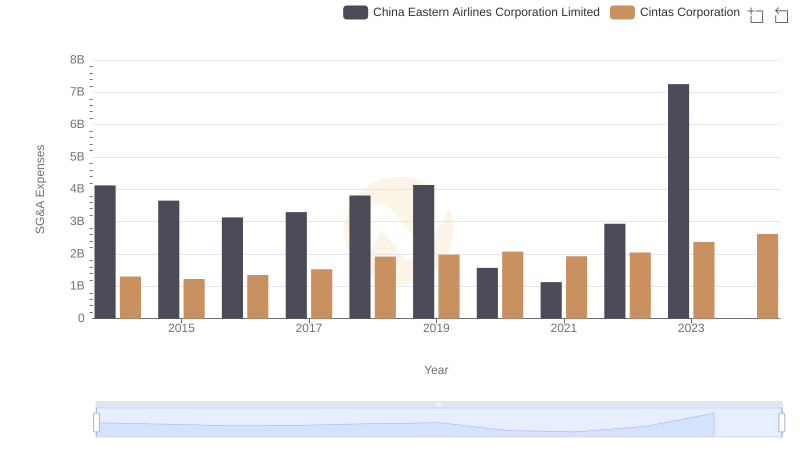
Cintas Corporation and China Eastern Airlines Corporation Limited: SG&A Spending Patterns Compared
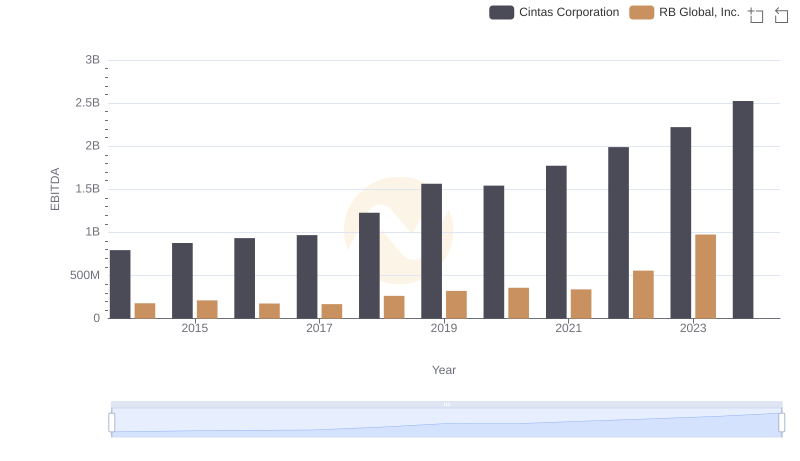
Cintas Corporation and RB Global, Inc.: A Detailed Examination of EBITDA Performance