| __timestamp | Cintas Corporation | Expeditors International of Washington, Inc. |
|---|---|---|
| Wednesday, January 1, 2014 | 1302752000 | 38125000 |
| Thursday, January 1, 2015 | 1224930000 | 41990000 |
| Friday, January 1, 2016 | 1348122000 | 41763000 |
| Sunday, January 1, 2017 | 1527380000 | 44290000 |
| Monday, January 1, 2018 | 1916792000 | 45346000 |
| Tuesday, January 1, 2019 | 1980644000 | 44002000 |
| Wednesday, January 1, 2020 | 2071052000 | 18436000 |
| Friday, January 1, 2021 | 1929159000 | 16026000 |
| Saturday, January 1, 2022 | 2044876000 | 24293000 |
| Sunday, January 1, 2023 | 2370704000 | 27913000 |
| Monday, January 1, 2024 | 2617783000 | 33331000 |
Igniting the spark of knowledge
In the ever-evolving landscape of corporate finance, understanding operational costs is crucial. Over the past decade, Cintas Corporation and Expeditors International of Washington, Inc. have showcased contrasting trends in their Selling, General, and Administrative (SG&A) expenses. Cintas has seen a steady rise, with expenses growing by approximately 100% from 2014 to 2023. This reflects their strategic expansion and increased operational scale. In contrast, Expeditors experienced a more volatile pattern, with a notable dip in 2020 and 2021, possibly due to global disruptions. By 2023, their SG&A expenses were about 27% lower than in 2018. This divergence highlights the distinct operational strategies and market responses of these two industry giants. As we look to 2024, Cintas continues its upward trajectory, while Expeditors' data remains incomplete, leaving room for speculation on their future financial maneuvers.
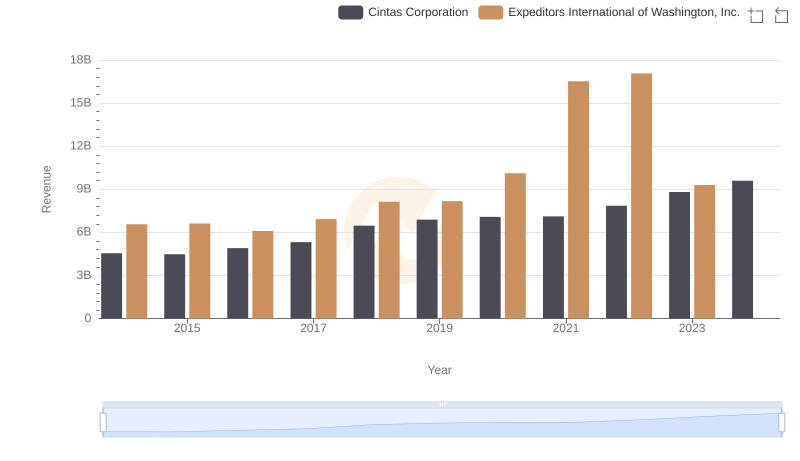
Cintas Corporation or Expeditors International of Washington, Inc.: Who Leads in Yearly Revenue?
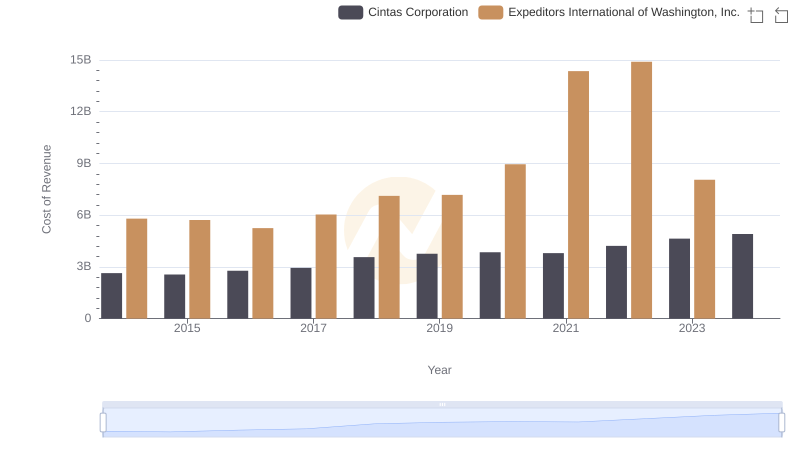
Cost Insights: Breaking Down Cintas Corporation and Expeditors International of Washington, Inc.'s Expenses
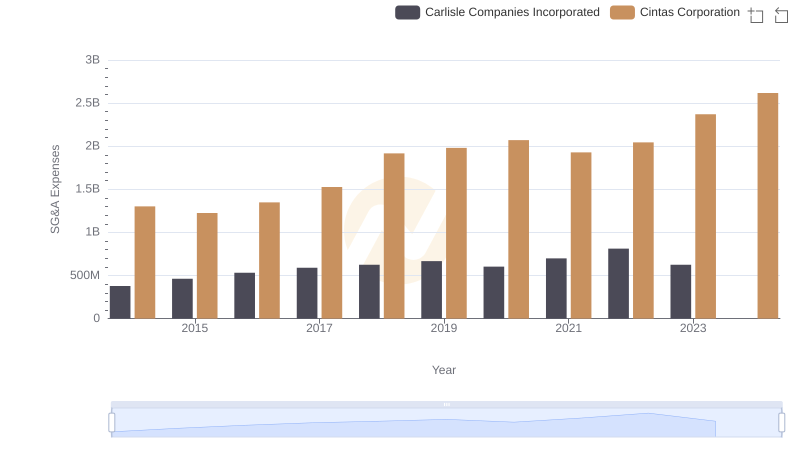
Who Optimizes SG&A Costs Better? Cintas Corporation or Carlisle Companies Incorporated
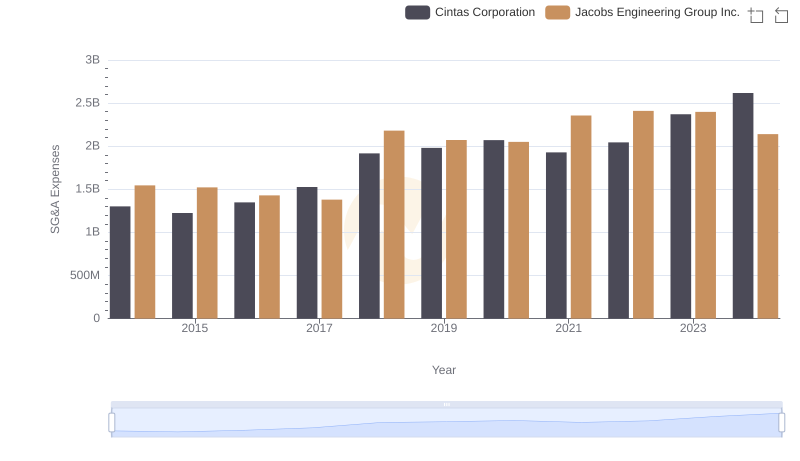
Cost Management Insights: SG&A Expenses for Cintas Corporation and Jacobs Engineering Group Inc.
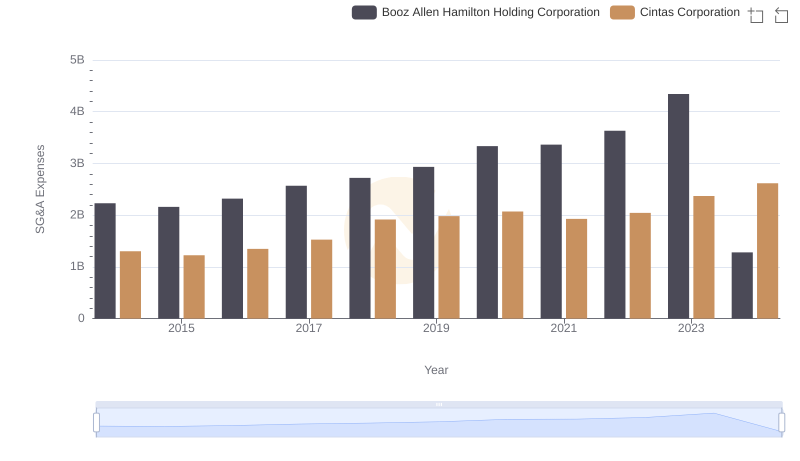
Cintas Corporation and Booz Allen Hamilton Holding Corporation: SG&A Spending Patterns Compared
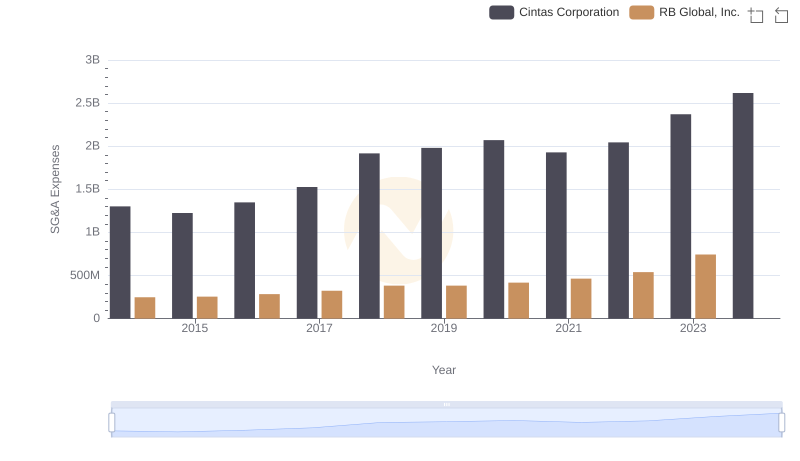
Cintas Corporation and RB Global, Inc.: SG&A Spending Patterns Compared
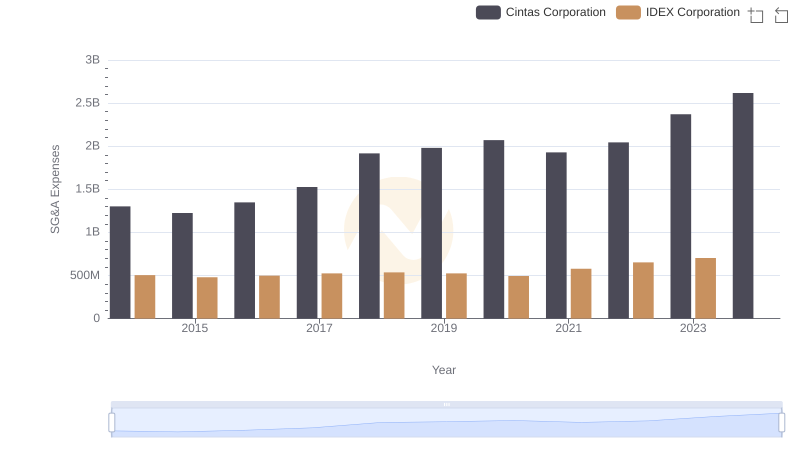
Operational Costs Compared: SG&A Analysis of Cintas Corporation and IDEX Corporation
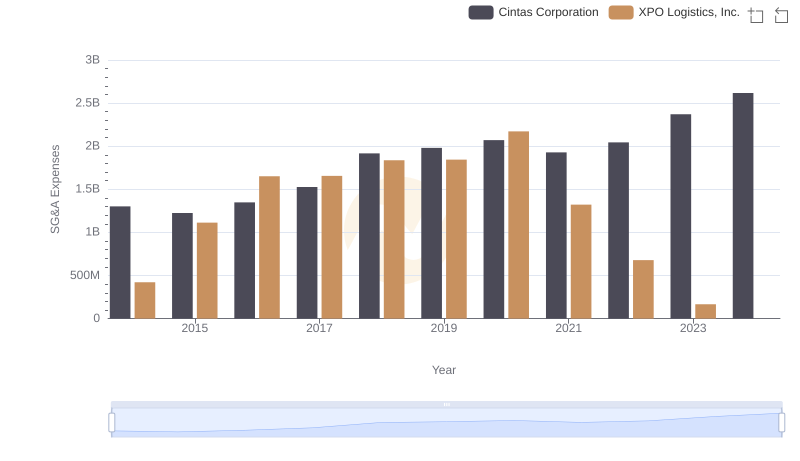
SG&A Efficiency Analysis: Comparing Cintas Corporation and XPO Logistics, Inc.
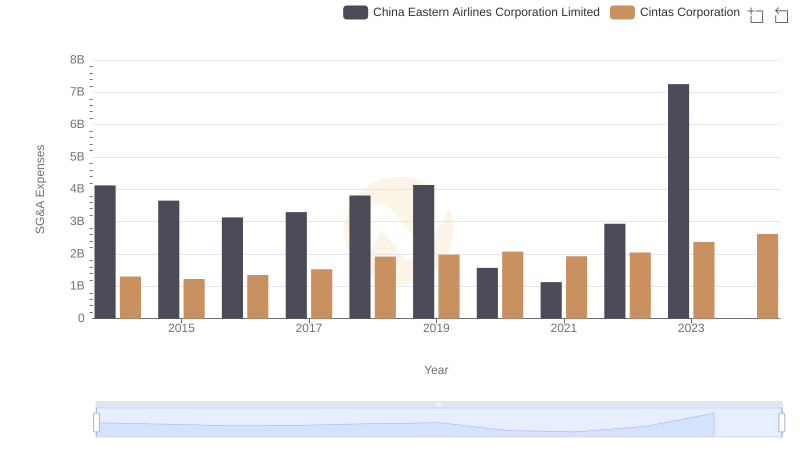
Cintas Corporation and China Eastern Airlines Corporation Limited: SG&A Spending Patterns Compared
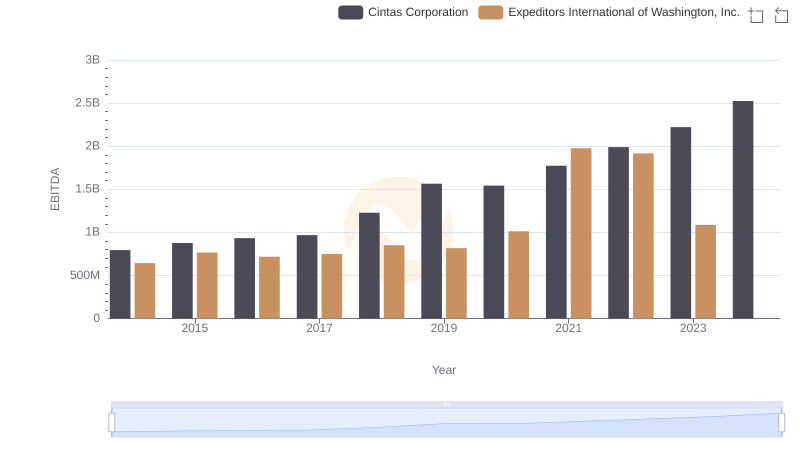
EBITDA Analysis: Evaluating Cintas Corporation Against Expeditors International of Washington, Inc.