| __timestamp | Booz Allen Hamilton Holding Corporation | Cintas Corporation |
|---|---|---|
| Wednesday, January 1, 2014 | 2229642000 | 1302752000 |
| Thursday, January 1, 2015 | 2159439000 | 1224930000 |
| Friday, January 1, 2016 | 2319592000 | 1348122000 |
| Sunday, January 1, 2017 | 2568511000 | 1527380000 |
| Monday, January 1, 2018 | 2719909000 | 1916792000 |
| Tuesday, January 1, 2019 | 2932602000 | 1980644000 |
| Wednesday, January 1, 2020 | 3334378000 | 2071052000 |
| Friday, January 1, 2021 | 3362722000 | 1929159000 |
| Saturday, January 1, 2022 | 3633150000 | 2044876000 |
| Sunday, January 1, 2023 | 4341769000 | 2370704000 |
| Monday, January 1, 2024 | 1281443000 | 2617783000 |
Unlocking the unknown
In the competitive landscape of corporate America, understanding spending patterns is crucial. Cintas Corporation and Booz Allen Hamilton Holding Corporation, two giants in their respective fields, have shown distinct trends in their Selling, General, and Administrative (SG&A) expenses over the past decade.
From 2014 to 2023, Booz Allen Hamilton's SG&A expenses surged by nearly 95%, peaking in 2023. This reflects their strategic investments in expanding consulting services and enhancing operational efficiencies. In contrast, Cintas Corporation's SG&A expenses grew by approximately 82% during the same period, indicating a steady focus on scaling their uniform and facility services.
Interestingly, 2024 marks a significant shift, with Booz Allen Hamilton's expenses dropping dramatically, while Cintas continues its upward trajectory. This divergence could signal a strategic pivot for Booz Allen Hamilton, possibly towards cost optimization or restructuring. As these trends unfold, stakeholders and investors should keenly observe how these spending patterns influence each company's market position and profitability.
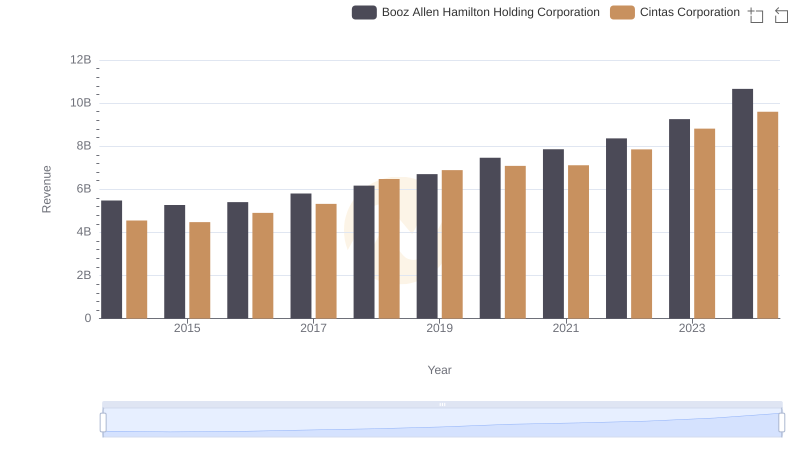
Cintas Corporation vs Booz Allen Hamilton Holding Corporation: Examining Key Revenue Metrics
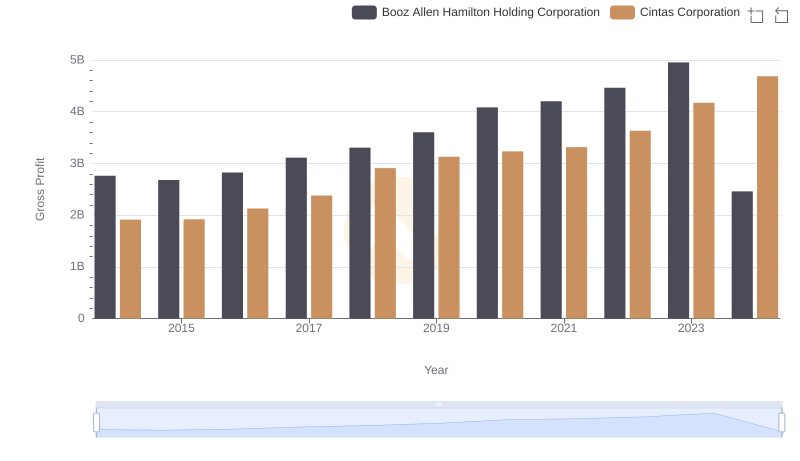
Cintas Corporation and Booz Allen Hamilton Holding Corporation: A Detailed Gross Profit Analysis
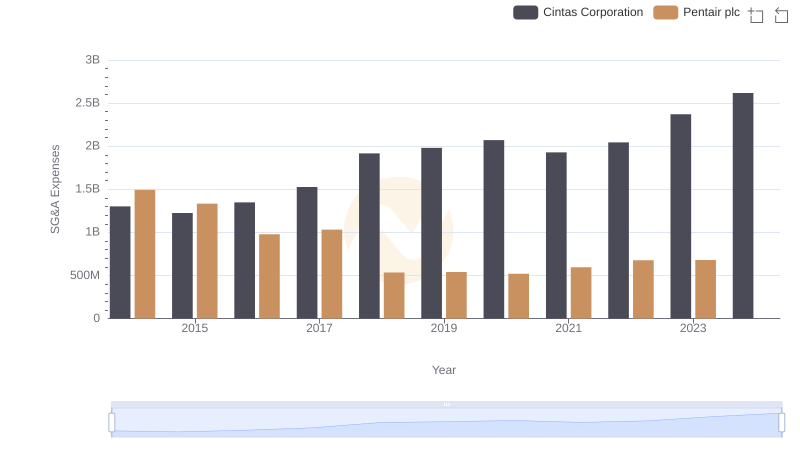
Breaking Down SG&A Expenses: Cintas Corporation vs Pentair plc
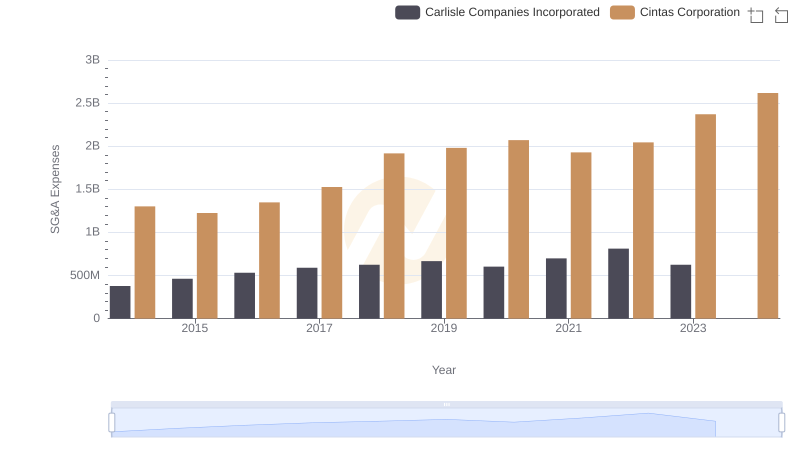
Who Optimizes SG&A Costs Better? Cintas Corporation or Carlisle Companies Incorporated
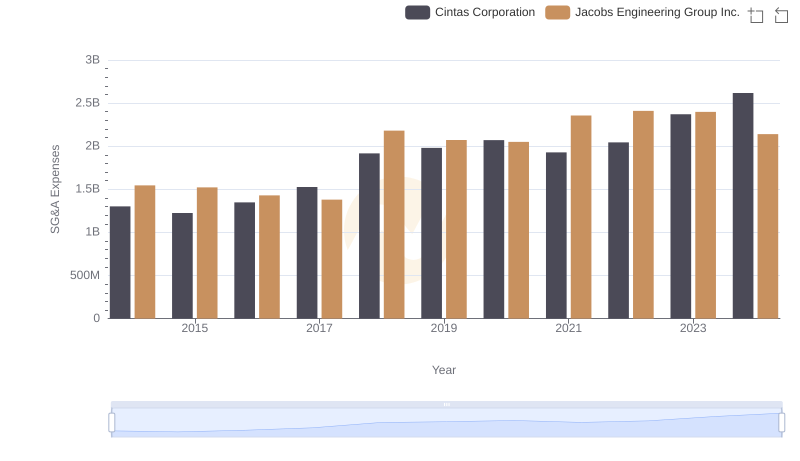
Cost Management Insights: SG&A Expenses for Cintas Corporation and Jacobs Engineering Group Inc.
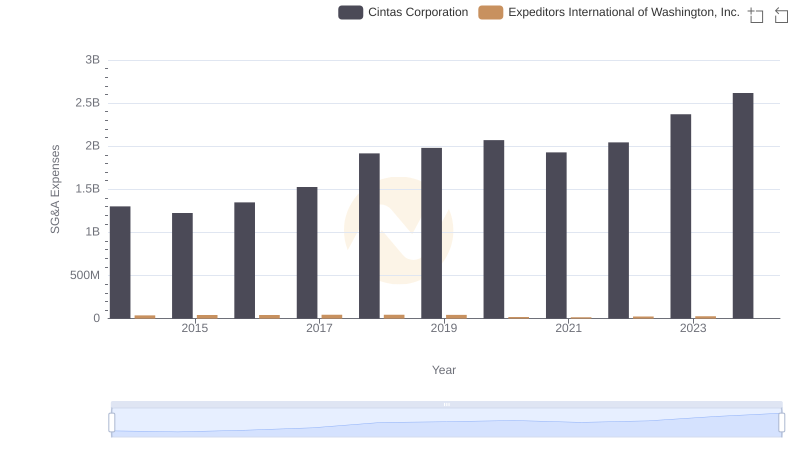
Operational Costs Compared: SG&A Analysis of Cintas Corporation and Expeditors International of Washington, Inc.
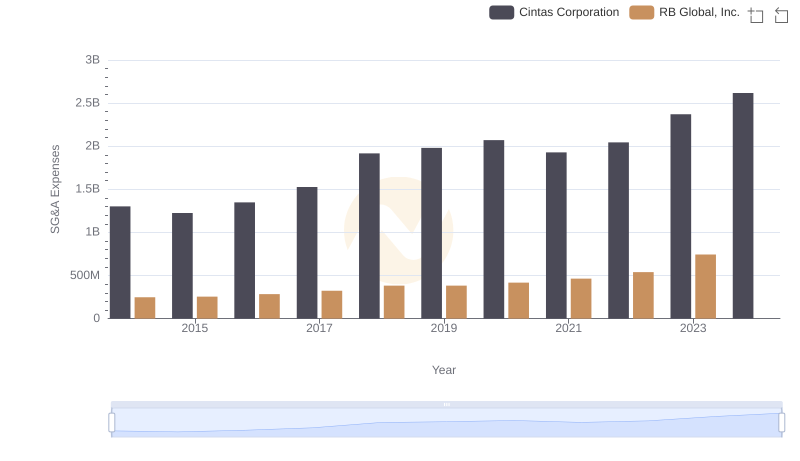
Cintas Corporation and RB Global, Inc.: SG&A Spending Patterns Compared
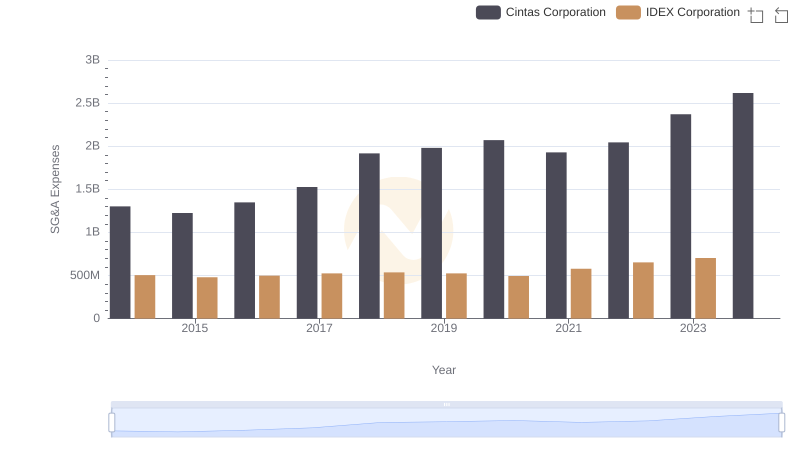
Operational Costs Compared: SG&A Analysis of Cintas Corporation and IDEX Corporation
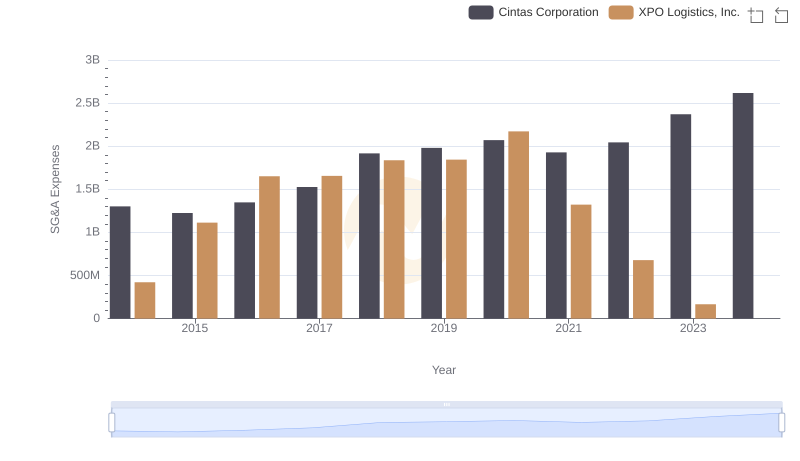
SG&A Efficiency Analysis: Comparing Cintas Corporation and XPO Logistics, Inc.
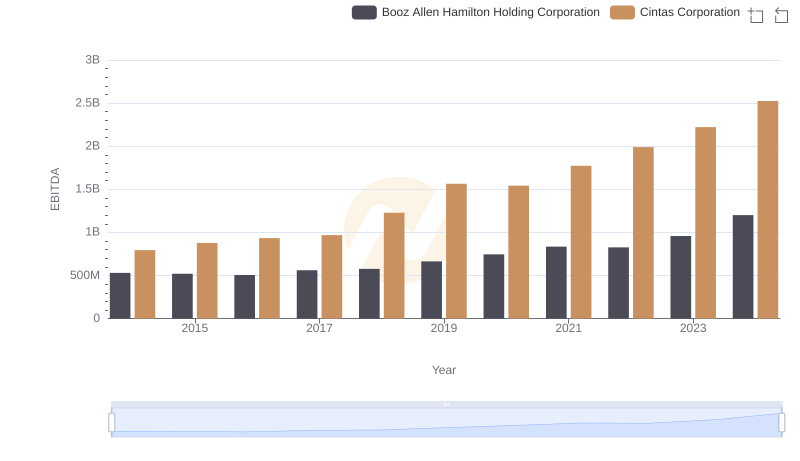
Cintas Corporation and Booz Allen Hamilton Holding Corporation: A Detailed Examination of EBITDA Performance