| __timestamp | Axon Enterprise, Inc. | Lennox International Inc. |
|---|---|---|
| Wednesday, January 1, 2014 | 54158000 | 573700000 |
| Thursday, January 1, 2015 | 69698000 | 580500000 |
| Friday, January 1, 2016 | 108076000 | 621000000 |
| Sunday, January 1, 2017 | 138692000 | 637700000 |
| Monday, January 1, 2018 | 156886000 | 608200000 |
| Tuesday, January 1, 2019 | 212959000 | 585900000 |
| Wednesday, January 1, 2020 | 307286000 | 555900000 |
| Friday, January 1, 2021 | 515007000 | 598900000 |
| Saturday, January 1, 2022 | 401575000 | 627200000 |
| Sunday, January 1, 2023 | 496874000 | 705500000 |
| Monday, January 1, 2024 | 730600000 |
In pursuit of knowledge
In the ever-evolving landscape of corporate finance, understanding the spending patterns of industry leaders is crucial. Axon Enterprise, Inc. and Lennox International Inc. offer a fascinating case study in contrasting strategies for managing Selling, General, and Administrative (SG&A) expenses. From 2014 to 2023, Axon saw a remarkable increase in SG&A expenses, growing by over 800%, reflecting its aggressive expansion and innovation strategies. In contrast, Lennox maintained a more stable trajectory, with a modest 23% increase over the same period, indicative of its steady market presence and operational efficiency.
The year 2021 marked a peak for Axon, with SG&A expenses reaching their highest, while Lennox continued its consistent growth into 2023. Notably, data for Axon in 2024 is missing, suggesting a potential shift or strategic change. This comparison highlights the diverse approaches companies take in navigating financial landscapes, offering valuable insights for investors and analysts alike.

Revenue Insights: Axon Enterprise, Inc. and Lennox International Inc. Performance Compared
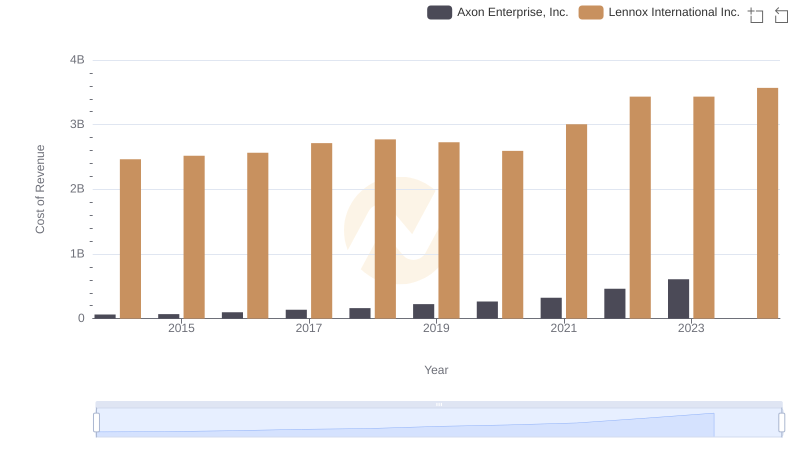
Cost of Revenue Trends: Axon Enterprise, Inc. vs Lennox International Inc.
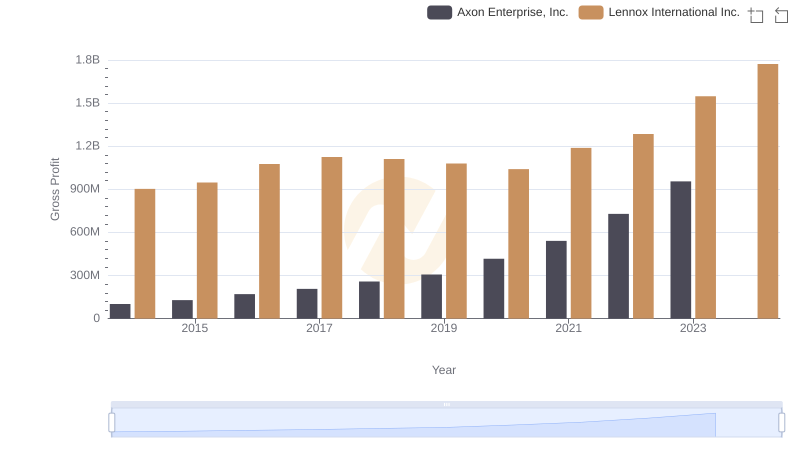
Gross Profit Analysis: Comparing Axon Enterprise, Inc. and Lennox International Inc.
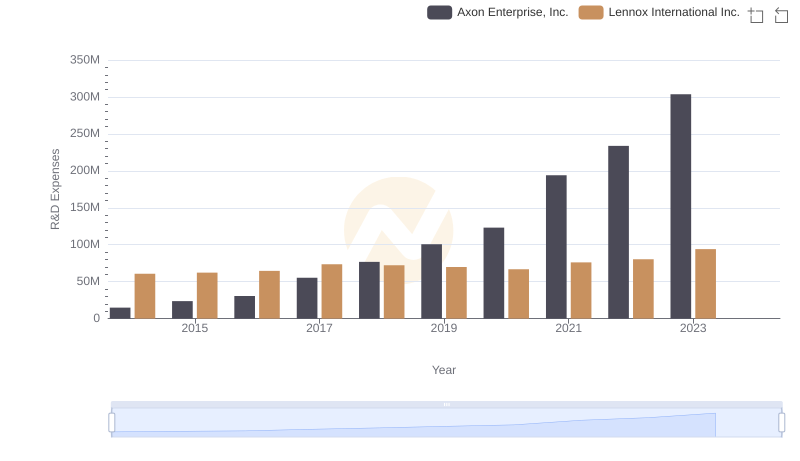
Who Prioritizes Innovation? R&D Spending Compared for Axon Enterprise, Inc. and Lennox International Inc.
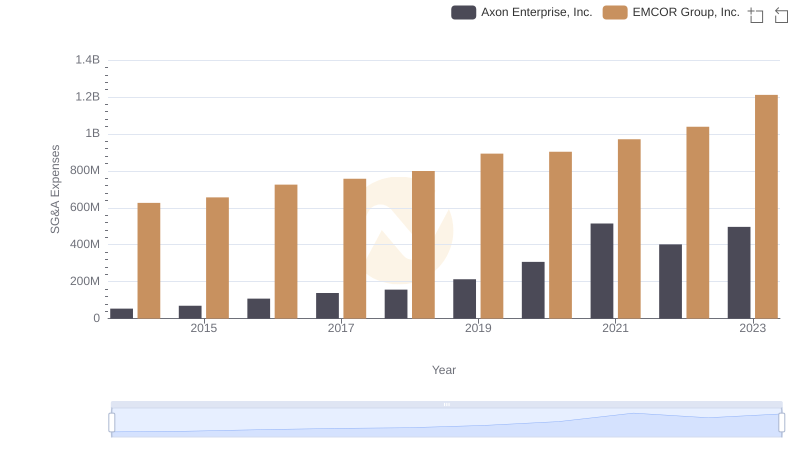
SG&A Efficiency Analysis: Comparing Axon Enterprise, Inc. and EMCOR Group, Inc.
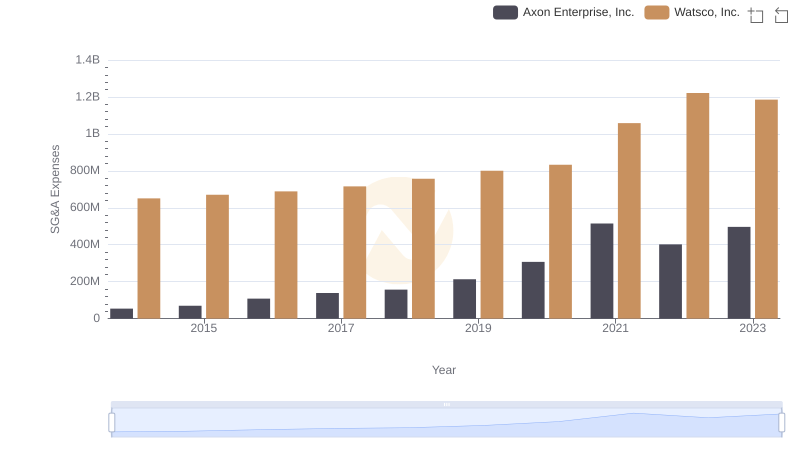
Comparing SG&A Expenses: Axon Enterprise, Inc. vs Watsco, Inc. Trends and Insights
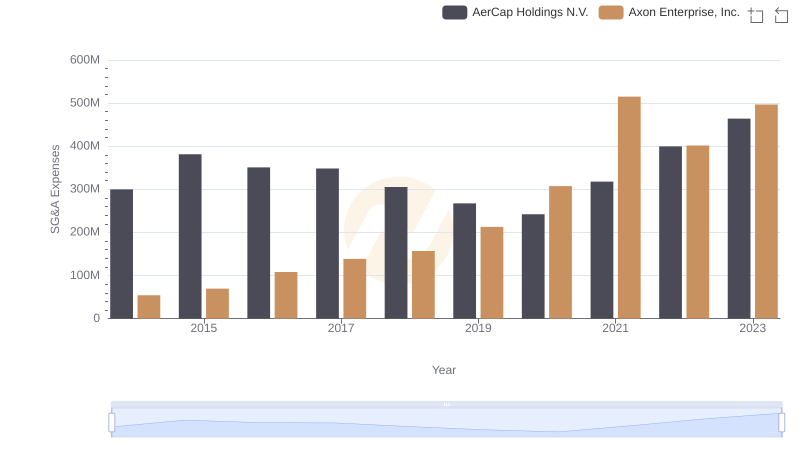
Comparing SG&A Expenses: Axon Enterprise, Inc. vs AerCap Holdings N.V. Trends and Insights

Axon Enterprise, Inc. vs Builders FirstSource, Inc.: SG&A Expense Trends
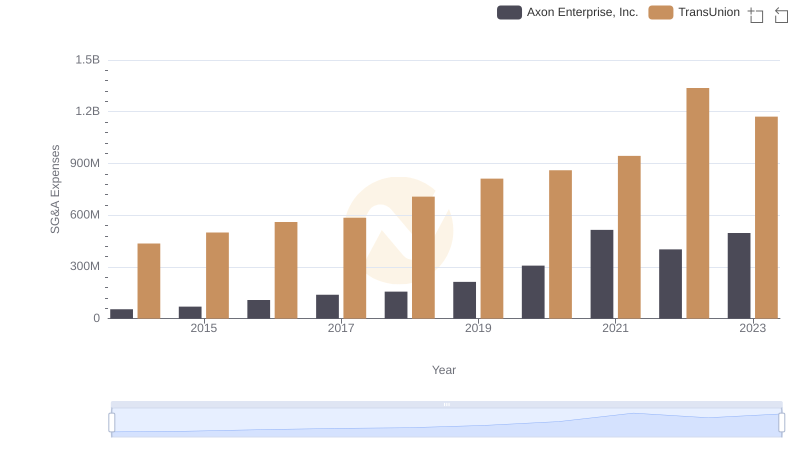
Selling, General, and Administrative Costs: Axon Enterprise, Inc. vs TransUnion
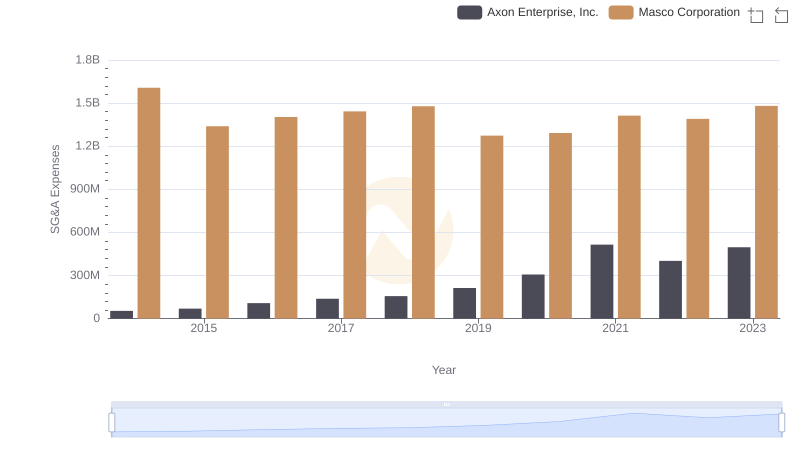
Operational Costs Compared: SG&A Analysis of Axon Enterprise, Inc. and Masco Corporation