| __timestamp | Axon Enterprise, Inc. | Stanley Black & Decker, Inc. |
|---|---|---|
| Wednesday, January 1, 2014 | 54158000 | 2595900000 |
| Thursday, January 1, 2015 | 69698000 | 2486400000 |
| Friday, January 1, 2016 | 108076000 | 2623900000 |
| Sunday, January 1, 2017 | 138692000 | 2980100000 |
| Monday, January 1, 2018 | 156886000 | 3171700000 |
| Tuesday, January 1, 2019 | 212959000 | 3041000000 |
| Wednesday, January 1, 2020 | 307286000 | 3089600000 |
| Friday, January 1, 2021 | 515007000 | 3240400000 |
| Saturday, January 1, 2022 | 401575000 | 3370000000 |
| Sunday, January 1, 2023 | 496874000 | 2829300000 |
| Monday, January 1, 2024 | 3310500000 |
Unlocking the unknown
In the ever-evolving landscape of corporate finance, understanding the efficiency of Selling, General, and Administrative (SG&A) expenses is crucial. Over the past decade, Axon Enterprise, Inc. and Stanley Black & Decker, Inc. have showcased contrasting trajectories in their SG&A expenditures.
From 2014 to 2023, Axon Enterprise, Inc. saw a remarkable increase in SG&A expenses, growing by over 800%, from approximately $54 million to nearly $497 million. This surge reflects Axon's aggressive expansion and investment in operational capabilities. In contrast, Stanley Black & Decker, Inc. maintained a more stable SG&A expenditure, fluctuating around the $3 billion mark, with a slight dip in 2023 to $2.8 billion.
This comparison highlights the strategic differences between a rapidly growing tech company and a well-established industrial giant. As businesses navigate the complexities of the modern market, understanding these dynamics is key to strategic planning and investment.
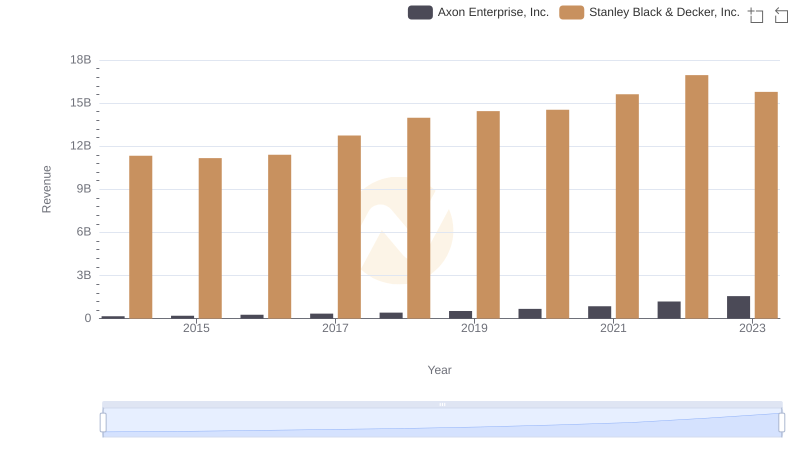
Revenue Showdown: Axon Enterprise, Inc. vs Stanley Black & Decker, Inc.

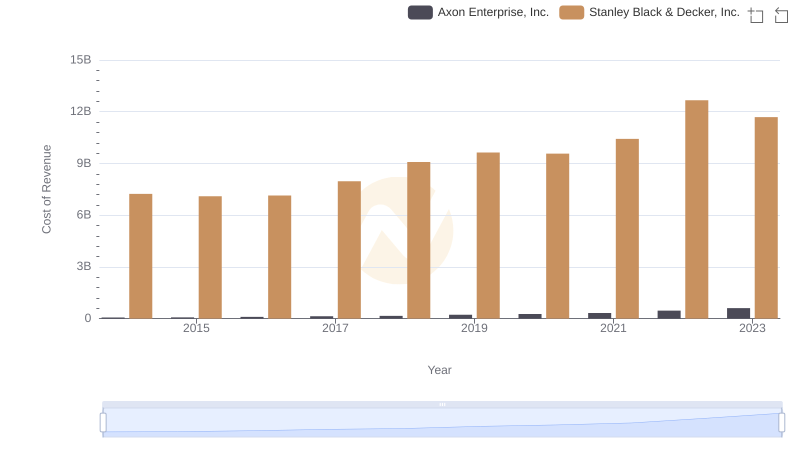
Cost of Revenue Trends: Axon Enterprise, Inc. vs Stanley Black & Decker, Inc.
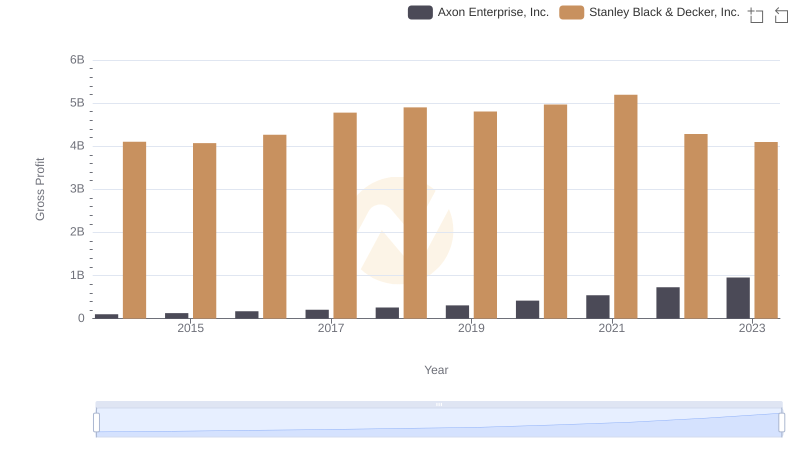
Axon Enterprise, Inc. and Stanley Black & Decker, Inc.: A Detailed Gross Profit Analysis
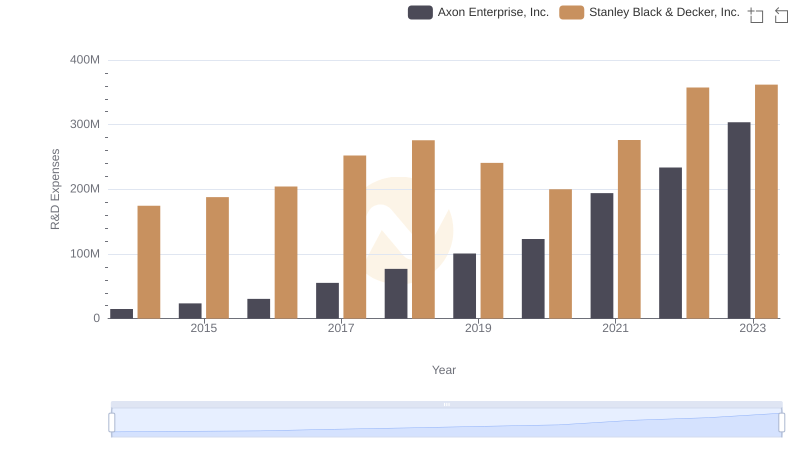
Who Prioritizes Innovation? R&D Spending Compared for Axon Enterprise, Inc. and Stanley Black & Decker, Inc.
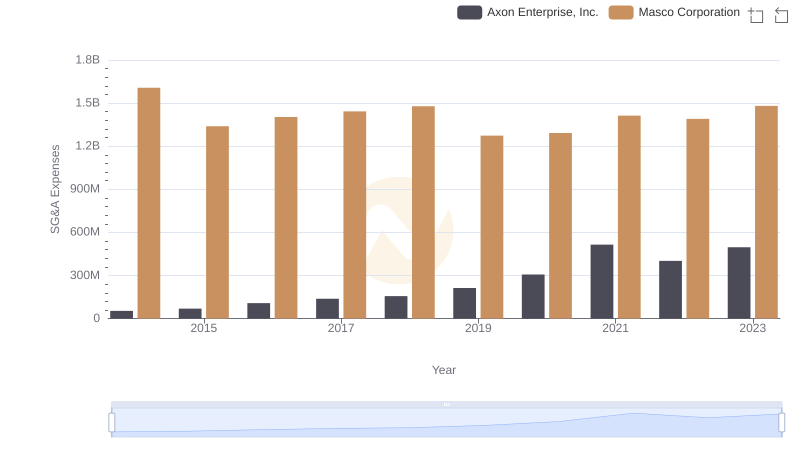
Operational Costs Compared: SG&A Analysis of Axon Enterprise, Inc. and Masco Corporation
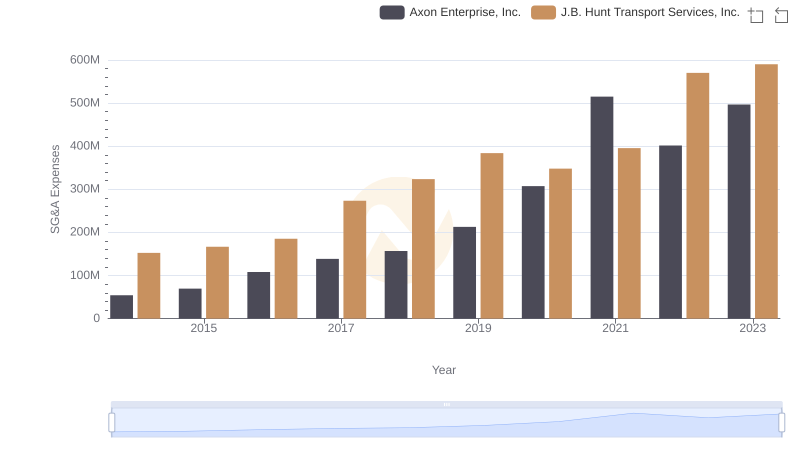
Who Optimizes SG&A Costs Better? Axon Enterprise, Inc. or J.B. Hunt Transport Services, Inc.
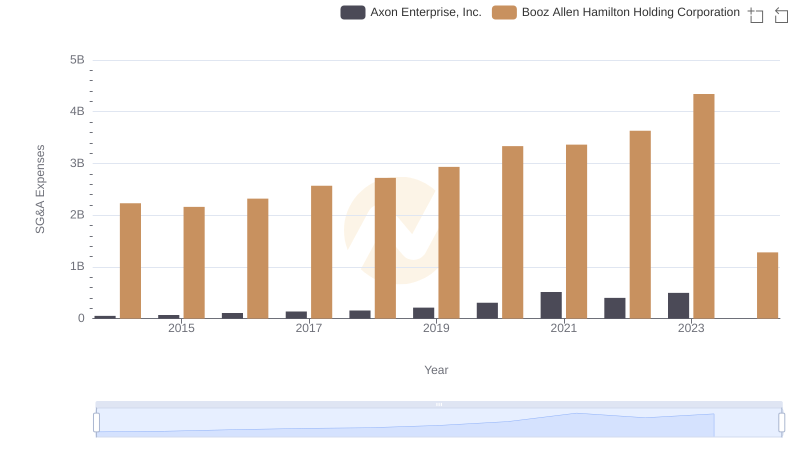
Axon Enterprise, Inc. vs Booz Allen Hamilton Holding Corporation: SG&A Expense Trends
Cost Insights: Breaking Down Axon Enterprise, Inc. and Stanley Black & Decker, Inc.'s Expenses

Who Generates Higher Gross Profit? Axon Enterprise, Inc. or Stanley Black & Decker, Inc.

Research and Development Expenses Breakdown: Axon Enterprise, Inc. vs Stanley Black & Decker, Inc.
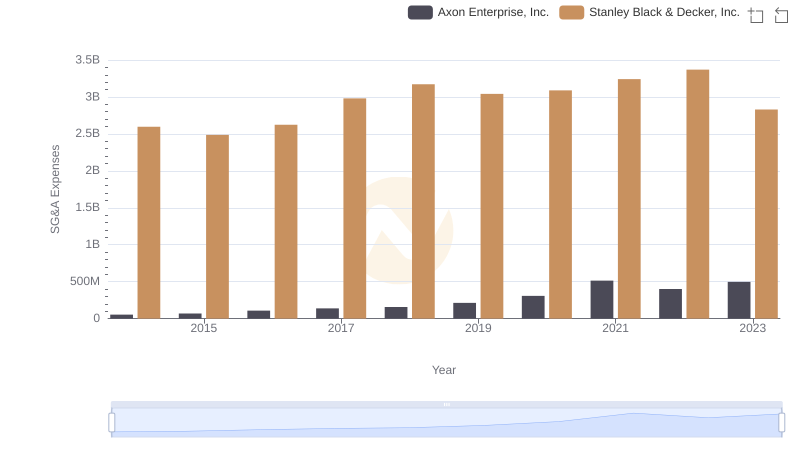
Axon Enterprise, Inc. vs Stanley Black & Decker, Inc.: SG&A Expense Trends