| __timestamp | Axon Enterprise, Inc. | Jacobs Engineering Group Inc. |
|---|---|---|
| Wednesday, January 1, 2014 | 54158000 | 1545716000 |
| Thursday, January 1, 2015 | 69698000 | 1522811000 |
| Friday, January 1, 2016 | 108076000 | 1429233000 |
| Sunday, January 1, 2017 | 138692000 | 1379983000 |
| Monday, January 1, 2018 | 156886000 | 2180399000 |
| Tuesday, January 1, 2019 | 212959000 | 2072177000 |
| Wednesday, January 1, 2020 | 307286000 | 2050695000 |
| Friday, January 1, 2021 | 515007000 | 2355683000 |
| Saturday, January 1, 2022 | 401575000 | 2409190000 |
| Sunday, January 1, 2023 | 496874000 | 2398078000 |
| Monday, January 1, 2024 | 2140320000 |
In pursuit of knowledge
In the ever-evolving landscape of corporate finance, understanding the spending patterns of industry leaders is crucial. Axon Enterprise, Inc. and Jacobs Engineering Group Inc. have shown distinct trajectories in their Selling, General, and Administrative (SG&A) expenses over the past decade. From 2014 to 2023, Axon’s SG&A expenses surged by over 800%, reflecting its aggressive growth strategy. In contrast, Jacobs Engineering maintained a more stable pattern, with a modest increase of around 55% during the same period.
While Axon’s spending peaked in 2021, Jacobs consistently allocated over 2 billion annually, showcasing its robust operational scale. Notably, 2024 data for Axon is missing, hinting at potential strategic shifts. This comparison not only highlights the dynamic nature of corporate spending but also underscores the importance of strategic financial management in sustaining growth and competitiveness.
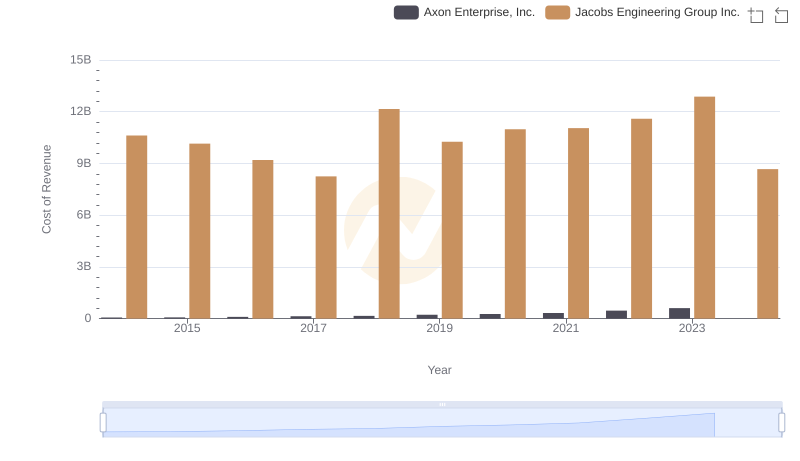
Analyzing Cost of Revenue: Axon Enterprise, Inc. and Jacobs Engineering Group Inc.
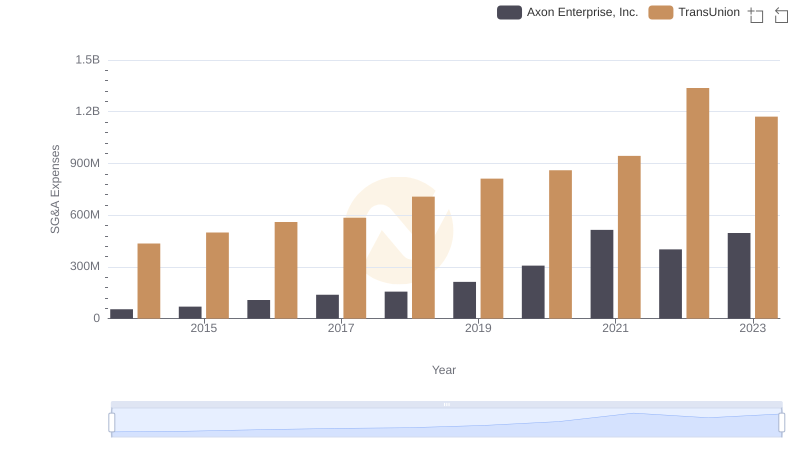
Selling, General, and Administrative Costs: Axon Enterprise, Inc. vs TransUnion
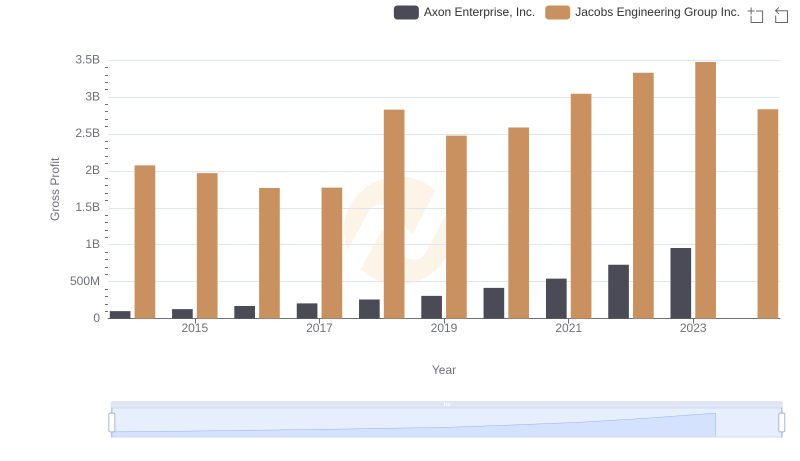
Axon Enterprise, Inc. vs Jacobs Engineering Group Inc.: A Gross Profit Performance Breakdown
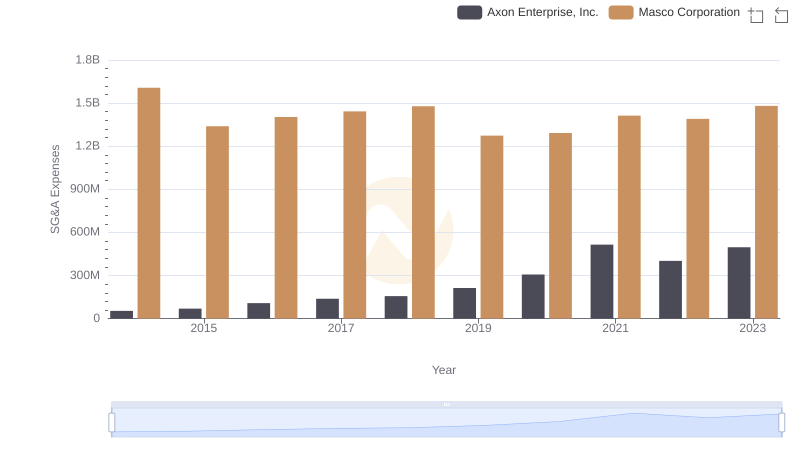
Operational Costs Compared: SG&A Analysis of Axon Enterprise, Inc. and Masco Corporation
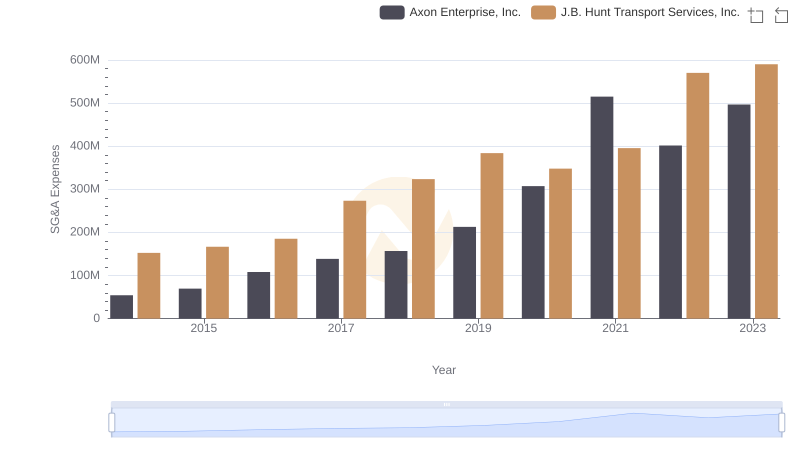
Who Optimizes SG&A Costs Better? Axon Enterprise, Inc. or J.B. Hunt Transport Services, Inc.
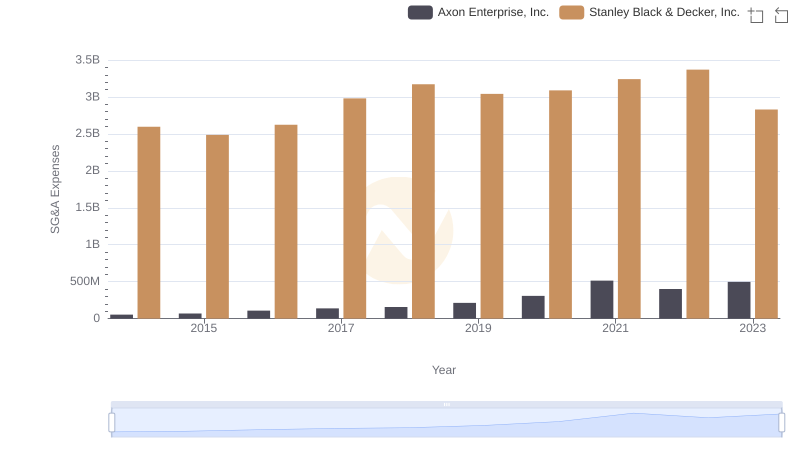
SG&A Efficiency Analysis: Comparing Axon Enterprise, Inc. and Stanley Black & Decker, Inc.
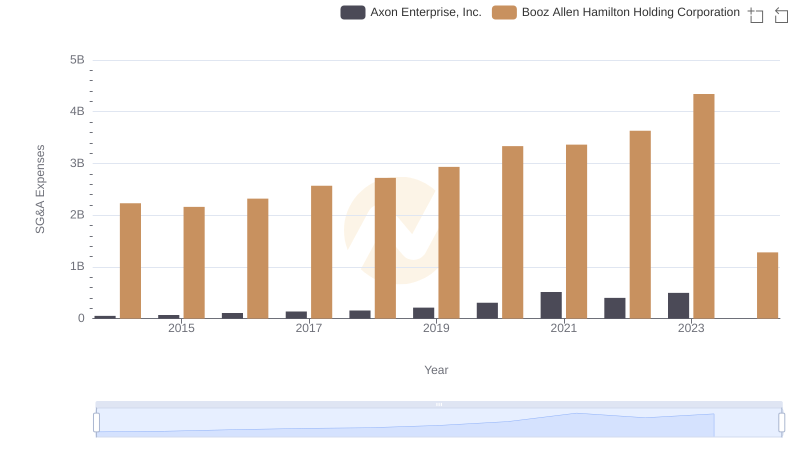
Axon Enterprise, Inc. vs Booz Allen Hamilton Holding Corporation: SG&A Expense Trends
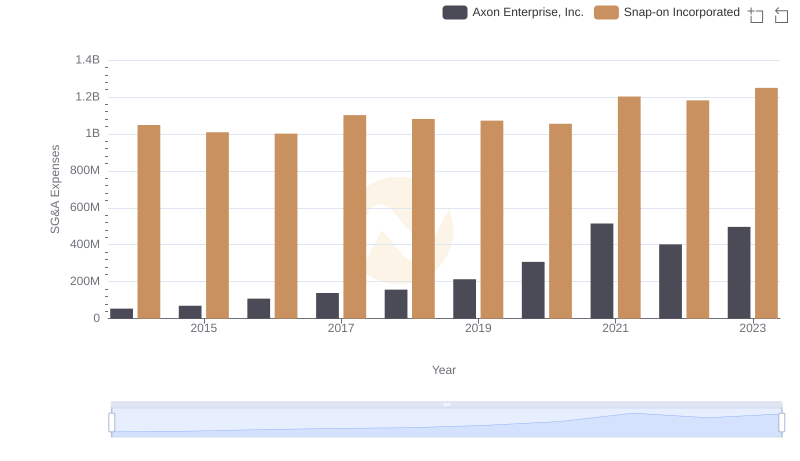
Axon Enterprise, Inc. or Snap-on Incorporated: Who Manages SG&A Costs Better?
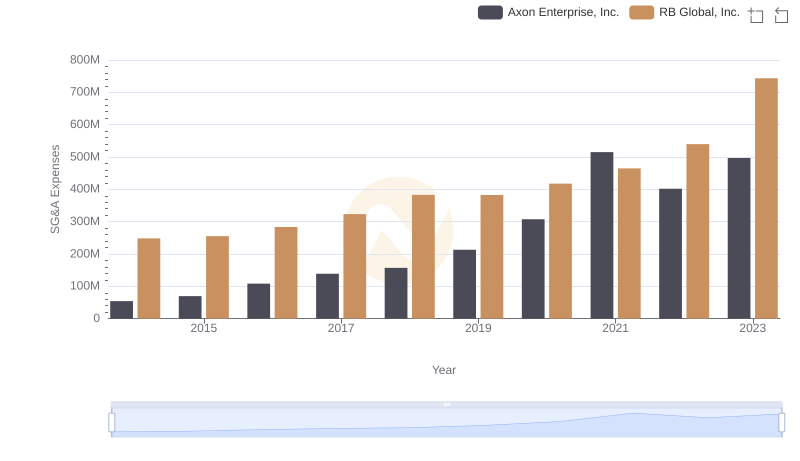
Axon Enterprise, Inc. vs RB Global, Inc.: SG&A Expense Trends
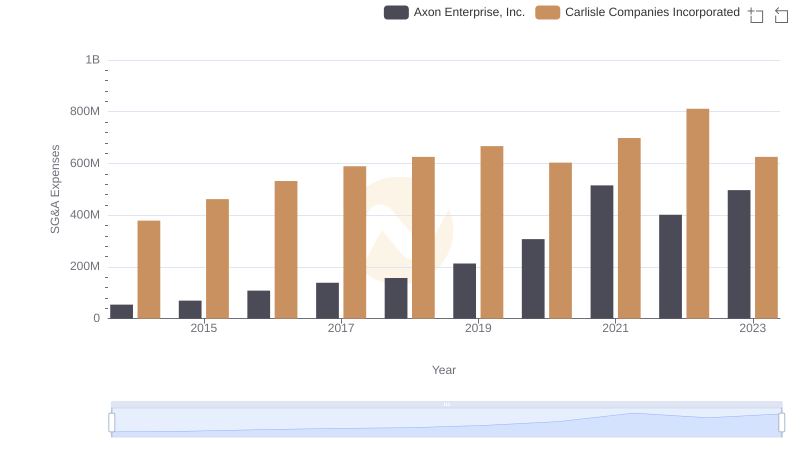
Breaking Down SG&A Expenses: Axon Enterprise, Inc. vs Carlisle Companies Incorporated

Breaking Down SG&A Expenses: Axon Enterprise, Inc. vs China Eastern Airlines Corporation Limited