| __timestamp | Amphenol Corporation | Analog Devices, Inc. |
|---|---|---|
| Wednesday, January 1, 2014 | 645100000 | 454676000 |
| Thursday, January 1, 2015 | 669100000 | 478972000 |
| Friday, January 1, 2016 | 798200000 | 461438000 |
| Sunday, January 1, 2017 | 878300000 | 691046000 |
| Monday, January 1, 2018 | 959500000 | 695937000 |
| Tuesday, January 1, 2019 | 971400000 | 648094000 |
| Wednesday, January 1, 2020 | 1014200000 | 659923000 |
| Friday, January 1, 2021 | 1226300000 | 915418000 |
| Saturday, January 1, 2022 | 1420900000 | 1266175000 |
| Sunday, January 1, 2023 | 1489900000 | 1273584000 |
| Monday, January 1, 2024 | 1855400000 | 1068640000 |
Unveiling the hidden dimensions of data
In the ever-evolving landscape of the semiconductor and electronics industry, understanding operational costs is crucial. This analysis delves into the Selling, General, and Administrative (SG&A) expenses of two industry giants: Analog Devices, Inc. and Amphenol Corporation, from 2014 to 2024.
Amphenol Corporation has consistently outpaced Analog Devices in SG&A expenses, with a notable 44% increase from 2014 to 2023. In 2023, Amphenol's SG&A expenses reached approximately 1.49 billion, marking a 130% rise since 2014. In contrast, Analog Devices saw a 180% increase over the same period, peaking at 1.27 billion in 2023.
This trend highlights Amphenol's aggressive expansion and operational strategies, while Analog Devices shows a steady yet significant growth trajectory. As we move into 2024, these insights provide a window into the strategic priorities of these industry leaders.
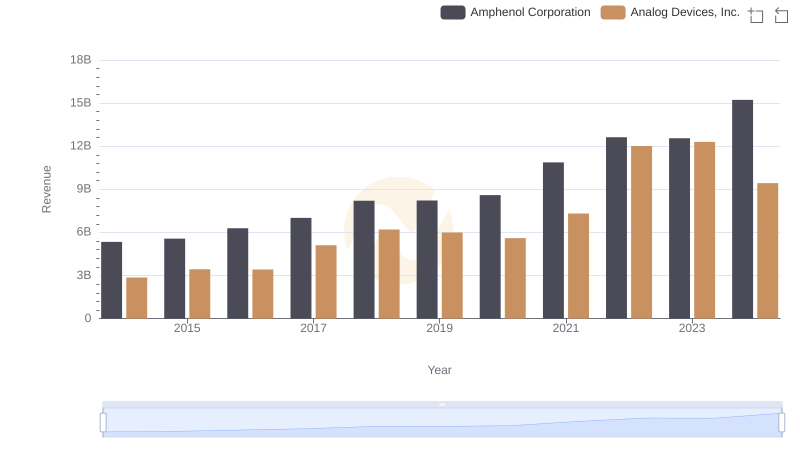
Analog Devices, Inc. vs Amphenol Corporation: Examining Key Revenue Metrics
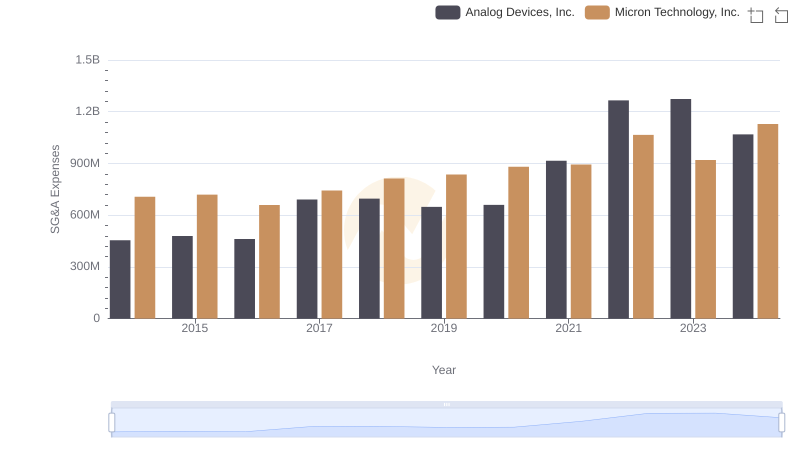
Cost Management Insights: SG&A Expenses for Analog Devices, Inc. and Micron Technology, Inc.
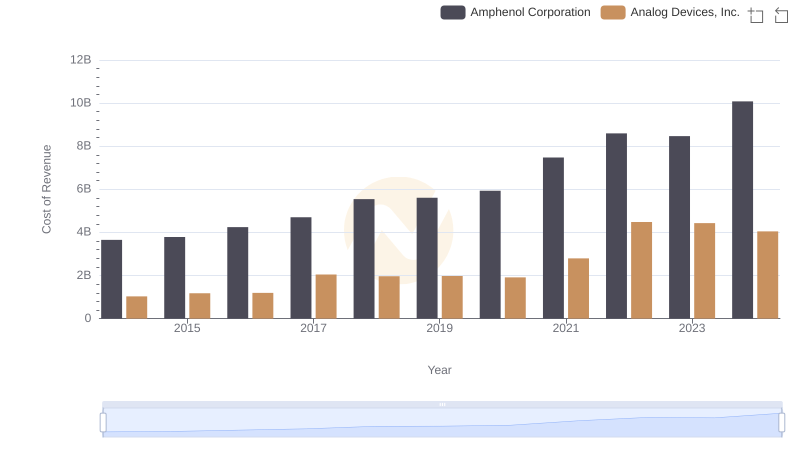
Cost of Revenue Comparison: Analog Devices, Inc. vs Amphenol Corporation
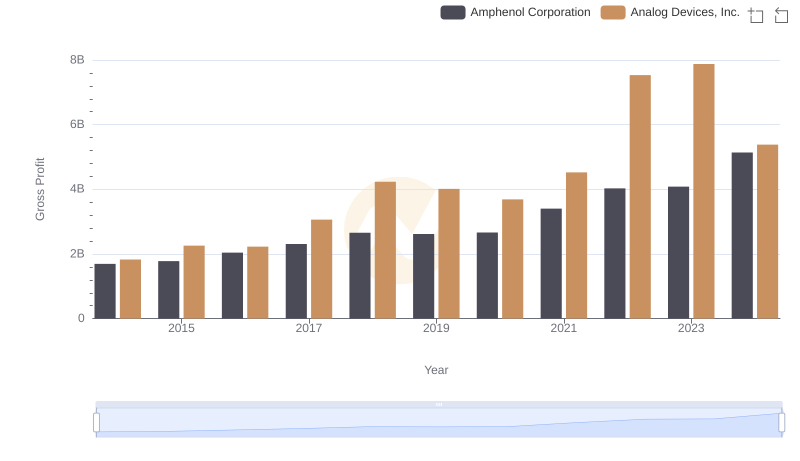
Who Generates Higher Gross Profit? Analog Devices, Inc. or Amphenol Corporation
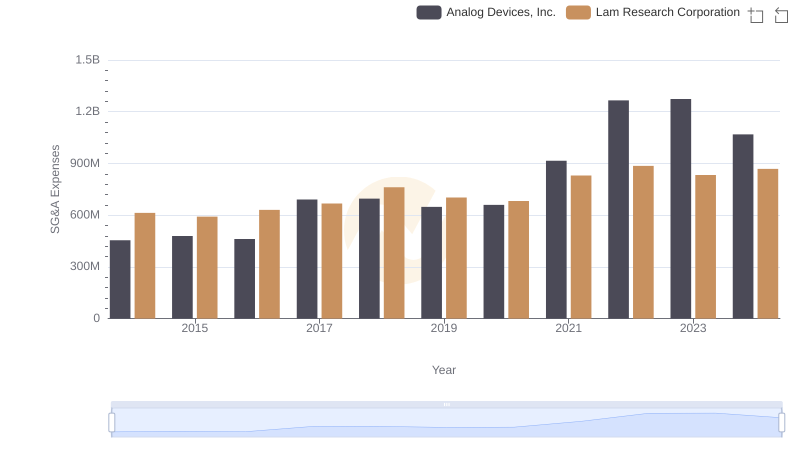
Analog Devices, Inc. or Lam Research Corporation: Who Manages SG&A Costs Better?
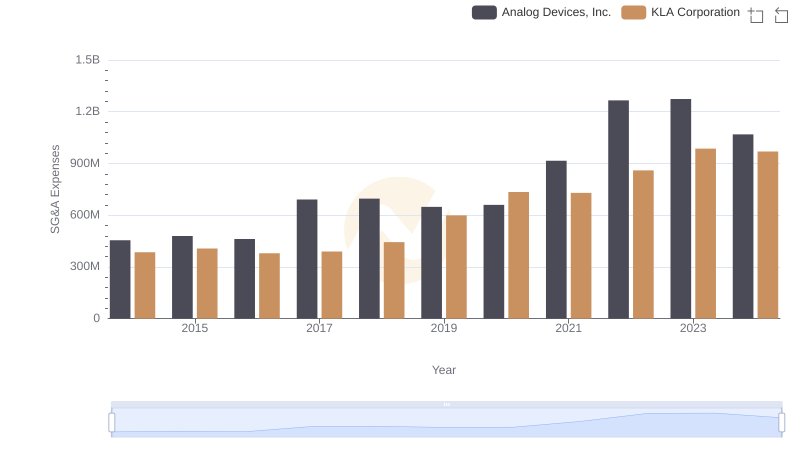
Who Optimizes SG&A Costs Better? Analog Devices, Inc. or KLA Corporation
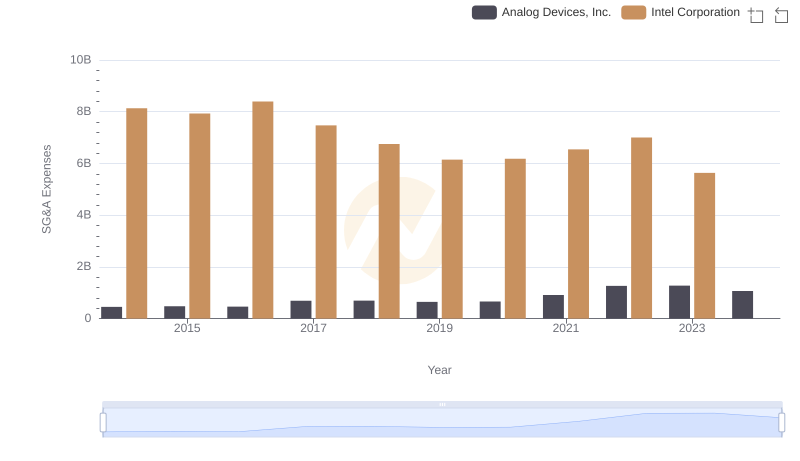
Selling, General, and Administrative Costs: Analog Devices, Inc. vs Intel Corporation
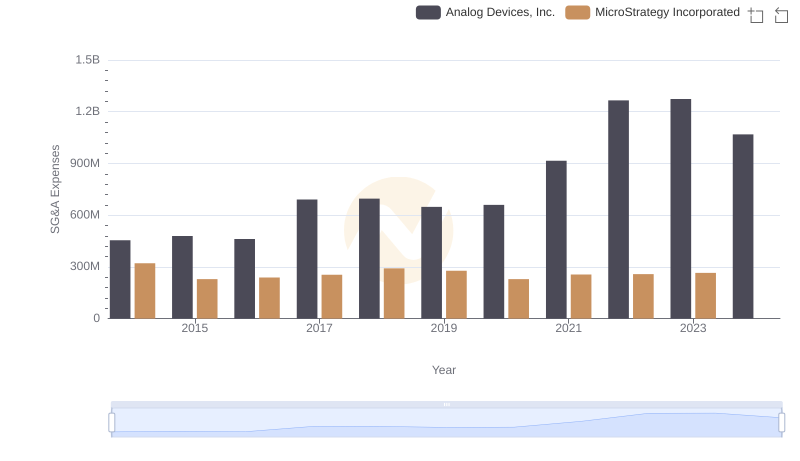
Comparing SG&A Expenses: Analog Devices, Inc. vs MicroStrategy Incorporated Trends and Insights
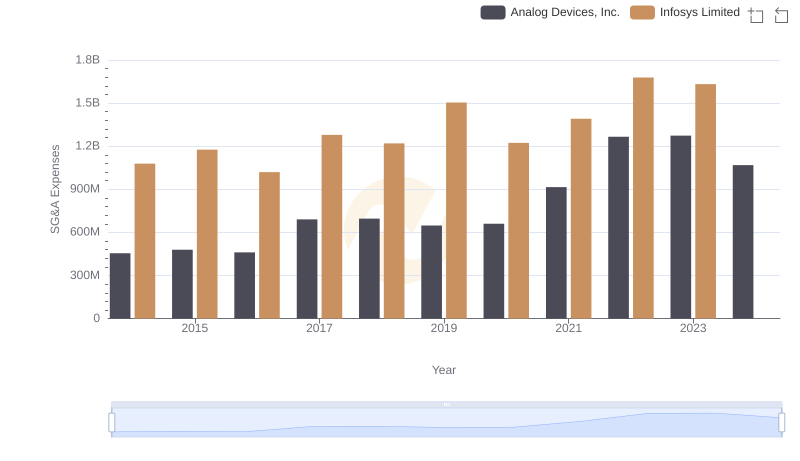
Cost Management Insights: SG&A Expenses for Analog Devices, Inc. and Infosys Limited
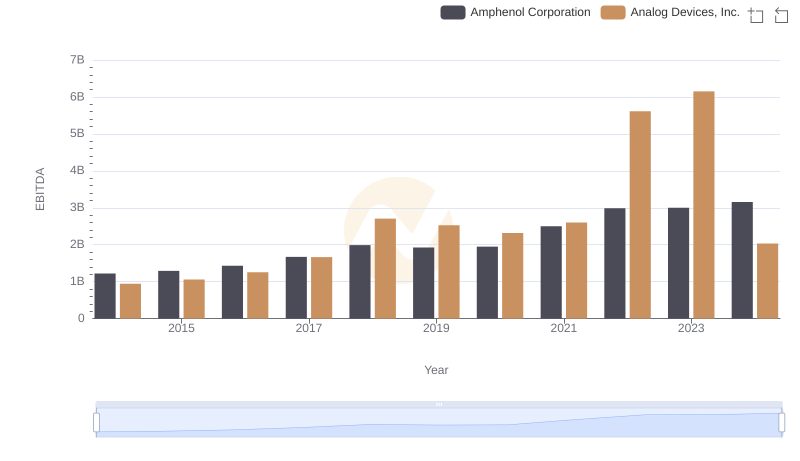
EBITDA Performance Review: Analog Devices, Inc. vs Amphenol Corporation
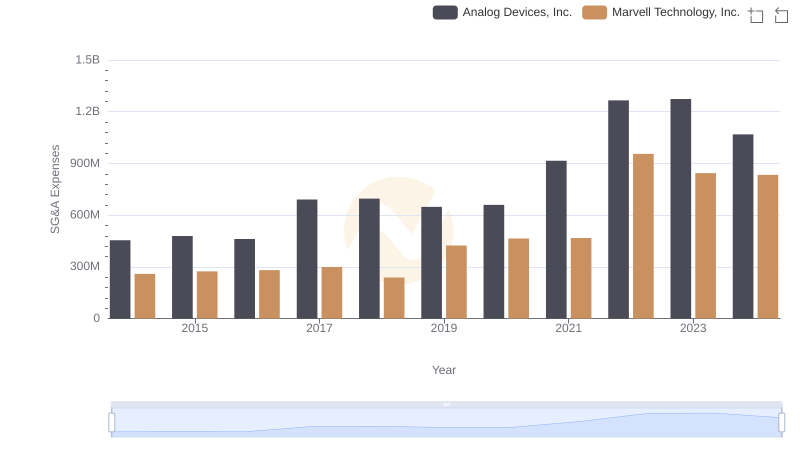
SG&A Efficiency Analysis: Comparing Analog Devices, Inc. and Marvell Technology, Inc.
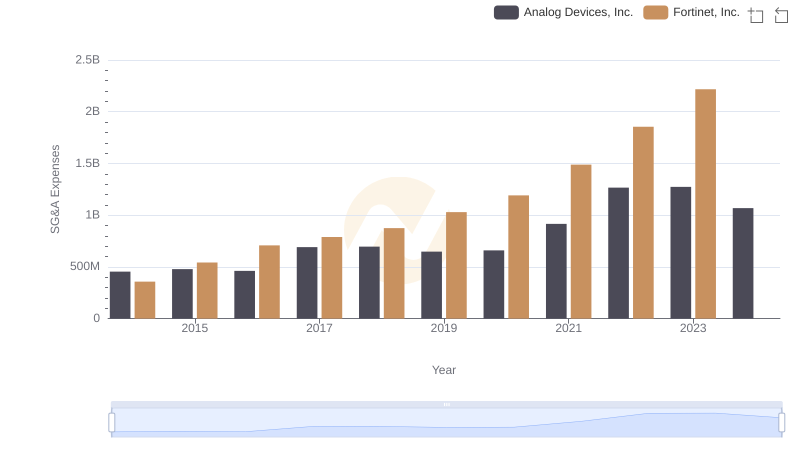
Operational Costs Compared: SG&A Analysis of Analog Devices, Inc. and Fortinet, Inc.