| __timestamp | Amphenol Corporation | Analog Devices, Inc. |
|---|---|---|
| Wednesday, January 1, 2014 | 1221000000 | 943421000 |
| Thursday, January 1, 2015 | 1292700000 | 1059384000 |
| Friday, January 1, 2016 | 1430700000 | 1255468000 |
| Sunday, January 1, 2017 | 1671500000 | 1665464000 |
| Monday, January 1, 2018 | 1989800000 | 2706642000 |
| Tuesday, January 1, 2019 | 1925600000 | 2527491000 |
| Wednesday, January 1, 2020 | 1950100000 | 2317701000 |
| Friday, January 1, 2021 | 2500300000 | 2600723000 |
| Saturday, January 1, 2022 | 2988700000 | 5611579000 |
| Sunday, January 1, 2023 | 3000700000 | 6150827000 |
| Monday, January 1, 2024 | 3875100000 | 2032798000 |
Infusing magic into the data realm
In the competitive landscape of the semiconductor and electronics industry, Analog Devices, Inc. and Amphenol Corporation have showcased remarkable EBITDA growth over the past decade. From 2014 to 2023, Amphenol's EBITDA surged by approximately 160%, reflecting its robust market strategies and operational efficiencies. Meanwhile, Analog Devices experienced an impressive 550% increase, peaking in 2023, before a notable dip in 2024.
Amphenol consistently expanded its EBITDA, with a steady climb from 2014's $1.2 billion to over $3 billion in 2024. Analog Devices, however, saw a dramatic rise, especially between 2021 and 2023, where its EBITDA more than doubled, reaching a zenith of $6.15 billion. This growth trajectory underscores the dynamic shifts and strategic pivots within these corporations, highlighting their resilience and adaptability in a rapidly evolving market.
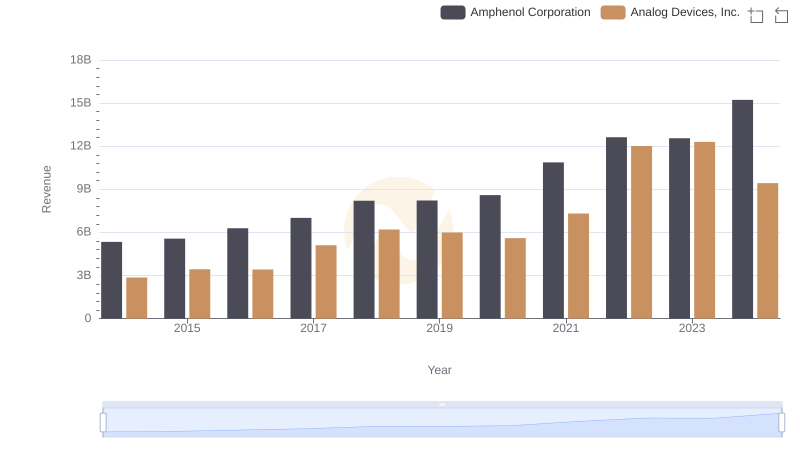
Analog Devices, Inc. vs Amphenol Corporation: Examining Key Revenue Metrics
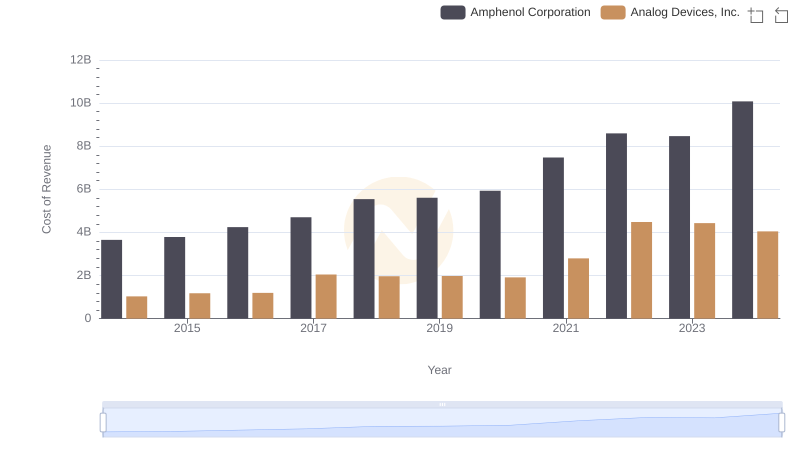
Cost of Revenue Comparison: Analog Devices, Inc. vs Amphenol Corporation
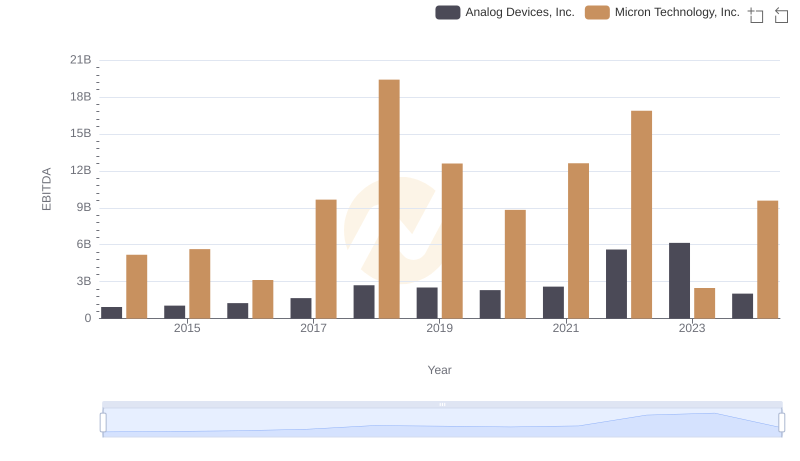
Comprehensive EBITDA Comparison: Analog Devices, Inc. vs Micron Technology, Inc.
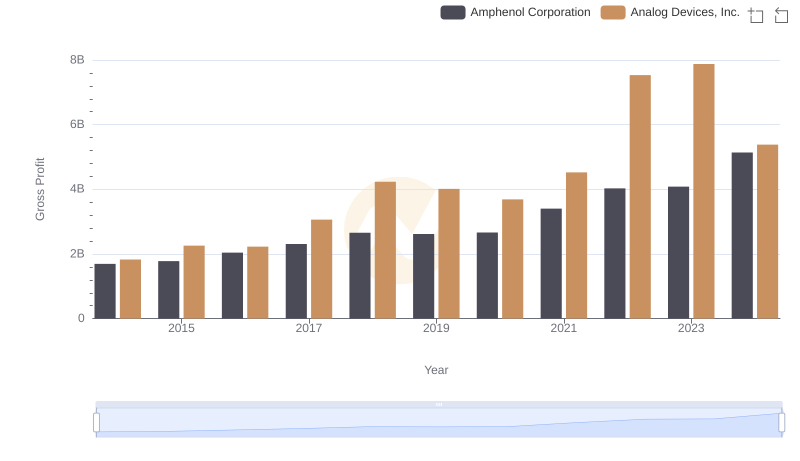
Who Generates Higher Gross Profit? Analog Devices, Inc. or Amphenol Corporation
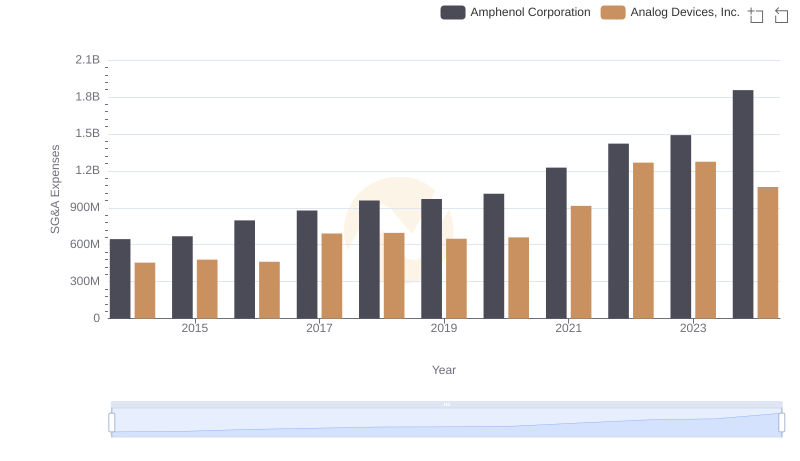
Operational Costs Compared: SG&A Analysis of Analog Devices, Inc. and Amphenol Corporation

Analog Devices, Inc. vs Lam Research Corporation: In-Depth EBITDA Performance Comparison
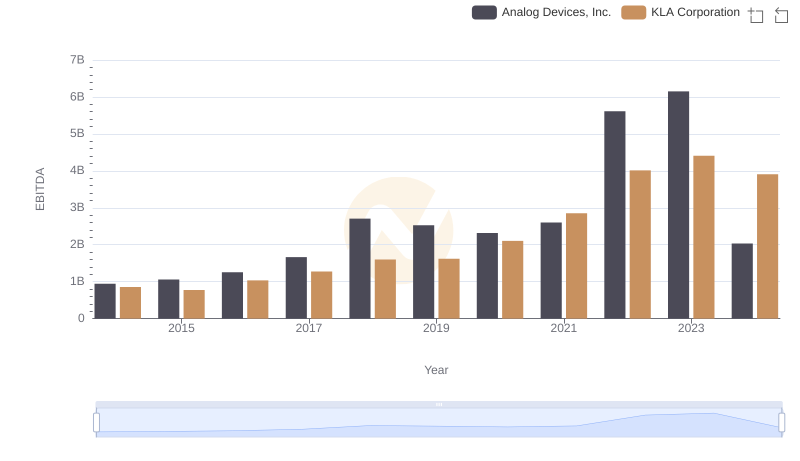
EBITDA Metrics Evaluated: Analog Devices, Inc. vs KLA Corporation
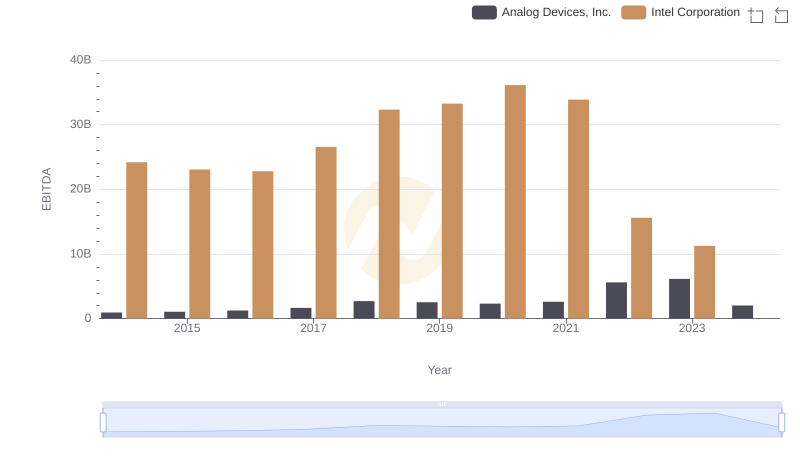
Professional EBITDA Benchmarking: Analog Devices, Inc. vs Intel Corporation
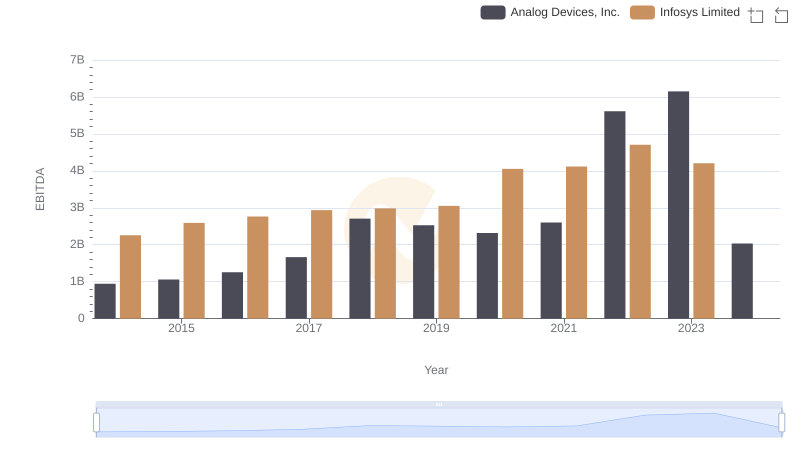
Comprehensive EBITDA Comparison: Analog Devices, Inc. vs Infosys Limited
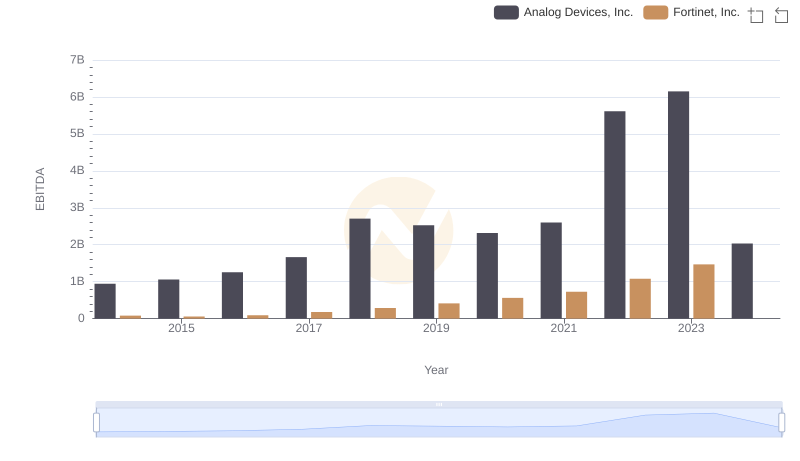
Analog Devices, Inc. and Fortinet, Inc.: A Detailed Examination of EBITDA Performance
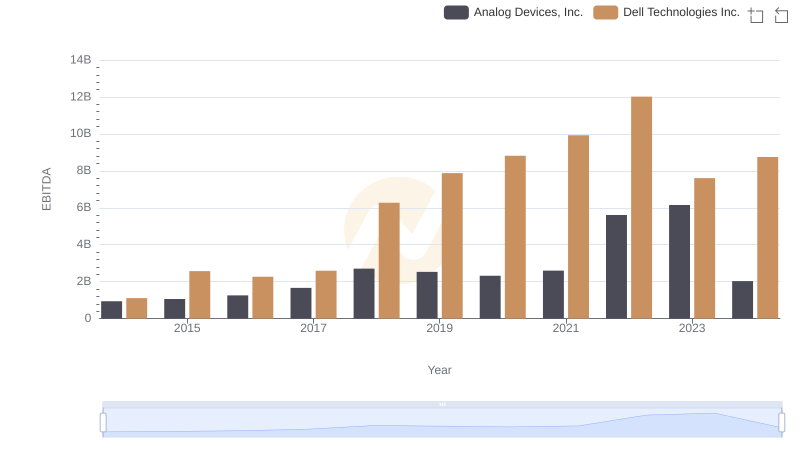
Analog Devices, Inc. vs Dell Technologies Inc.: In-Depth EBITDA Performance Comparison
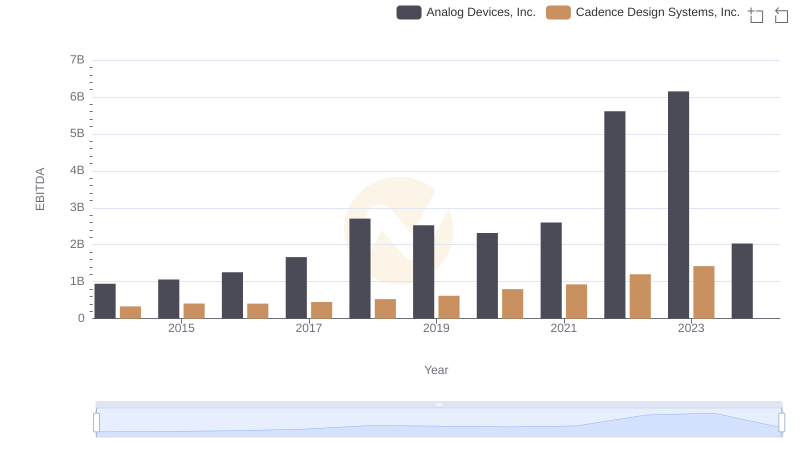
Comprehensive EBITDA Comparison: Analog Devices, Inc. vs Cadence Design Systems, Inc.