| __timestamp | Amphenol Corporation | Analog Devices, Inc. |
|---|---|---|
| Wednesday, January 1, 2014 | 3651700000 | 1034585000 |
| Thursday, January 1, 2015 | 3789200000 | 1175830000 |
| Friday, January 1, 2016 | 4246400000 | 1194236000 |
| Sunday, January 1, 2017 | 4701400000 | 2045907000 |
| Monday, January 1, 2018 | 5547100000 | 1967640000 |
| Tuesday, January 1, 2019 | 5609400000 | 1977315000 |
| Wednesday, January 1, 2020 | 5934800000 | 1912578000 |
| Friday, January 1, 2021 | 7474500000 | 2793274000 |
| Saturday, January 1, 2022 | 8594800000 | 4481479000 |
| Sunday, January 1, 2023 | 8470600000 | 4428321000 |
| Monday, January 1, 2024 | 10083000000 | 4045814000 |
Infusing magic into the data realm
In the competitive landscape of the electronics industry, understanding cost dynamics is crucial. Over the past decade, Amphenol Corporation and Analog Devices, Inc. have showcased contrasting trends in their cost of revenue. From 2014 to 2024, Amphenol's cost of revenue surged by approximately 176%, peaking at over $10 billion in 2024. This reflects their aggressive expansion and market penetration strategies. In contrast, Analog Devices, Inc. experienced a more moderate increase of around 291%, reaching over $4 billion in 2024. This growth trajectory highlights their focus on innovation and efficiency. Notably, 2022 marked a significant year for both companies, with Amphenol's costs rising by 14% from the previous year, while Analog Devices saw a remarkable 60% jump. These figures underscore the evolving strategies and market conditions influencing these industry leaders.
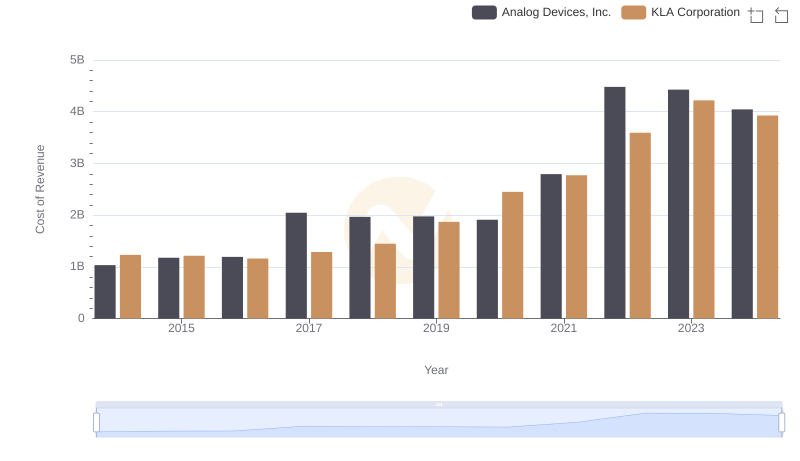
Cost of Revenue Comparison: Analog Devices, Inc. vs KLA Corporation
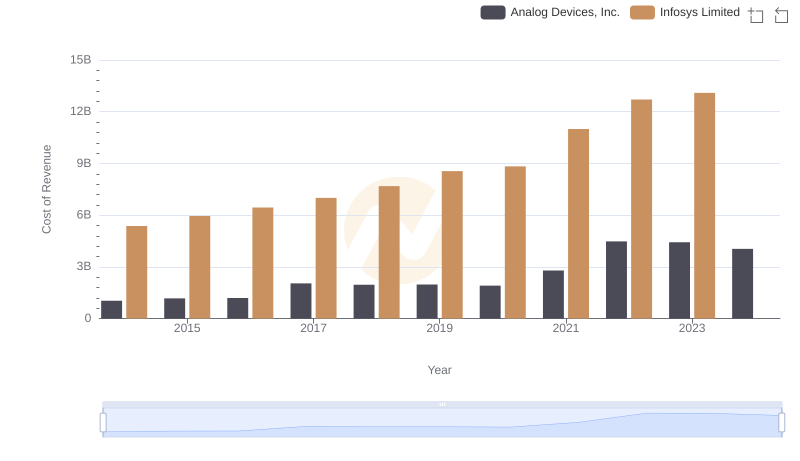
Comparing Cost of Revenue Efficiency: Analog Devices, Inc. vs Infosys Limited
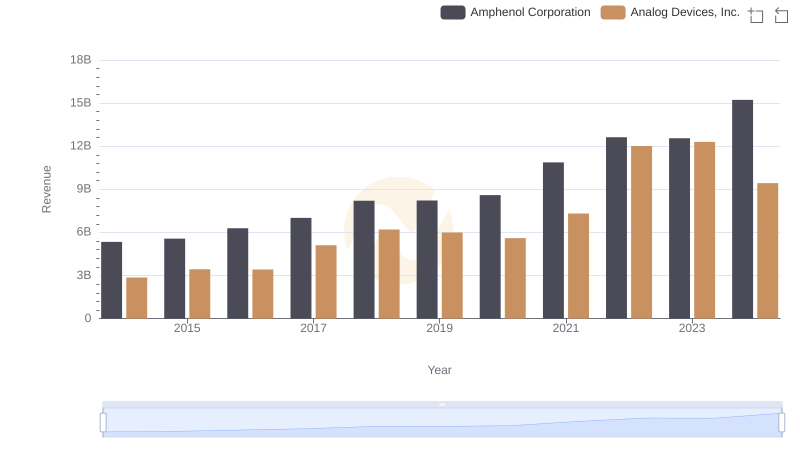
Analog Devices, Inc. vs Amphenol Corporation: Examining Key Revenue Metrics
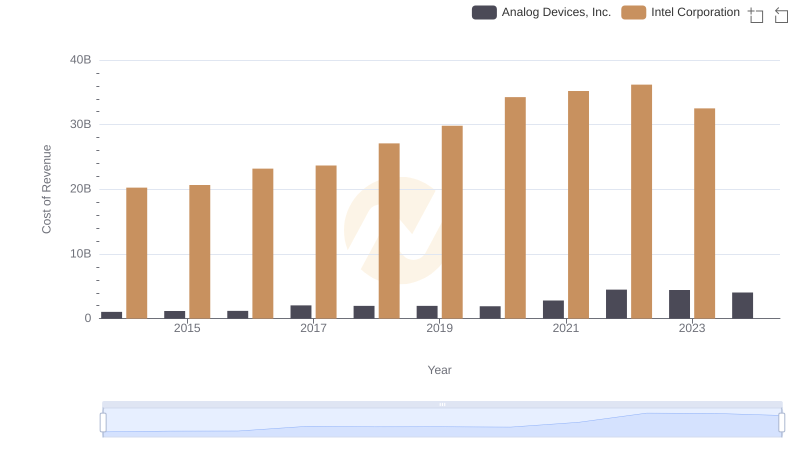
Cost of Revenue: Key Insights for Analog Devices, Inc. and Intel Corporation
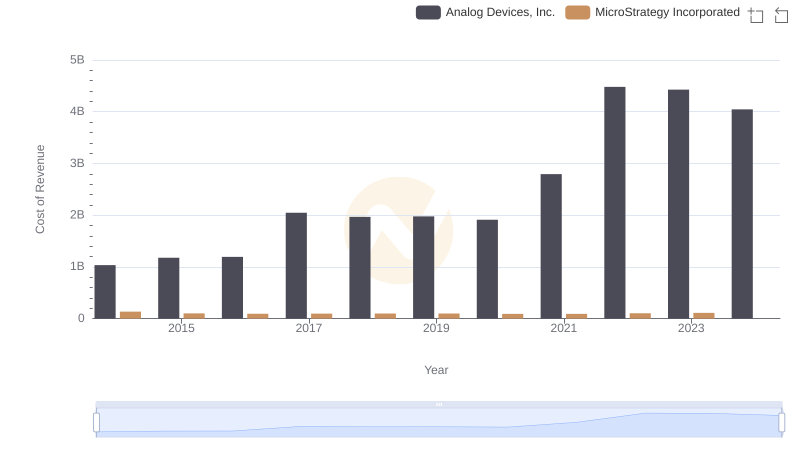
Cost of Revenue Comparison: Analog Devices, Inc. vs MicroStrategy Incorporated
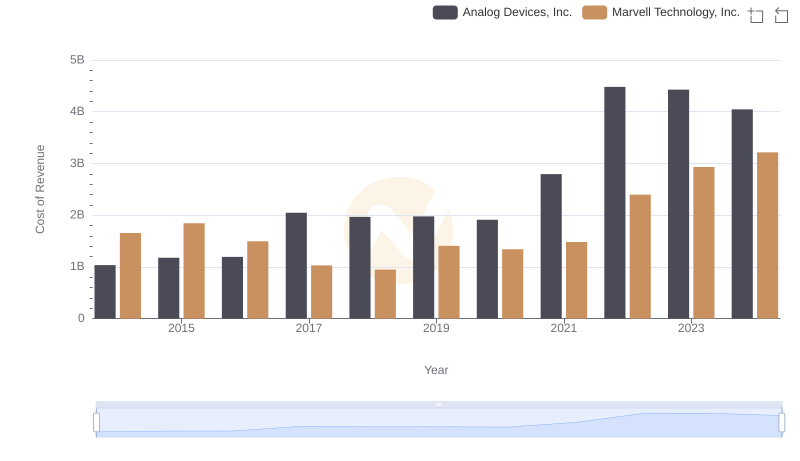
Cost of Revenue Comparison: Analog Devices, Inc. vs Marvell Technology, Inc.
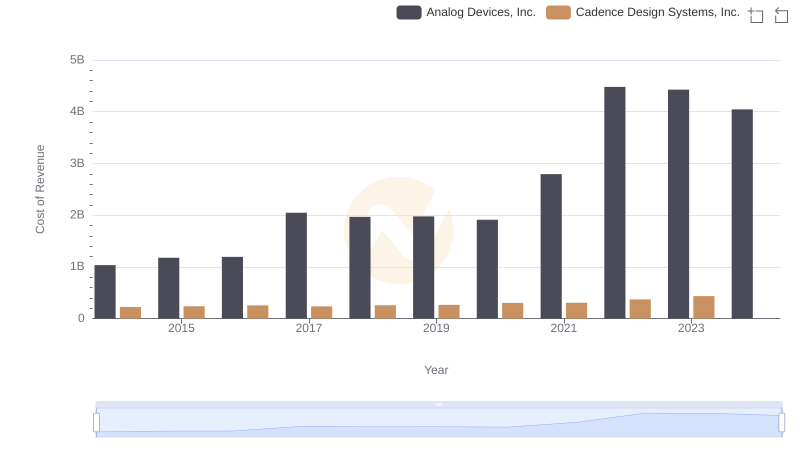
Analog Devices, Inc. vs Cadence Design Systems, Inc.: Efficiency in Cost of Revenue Explored
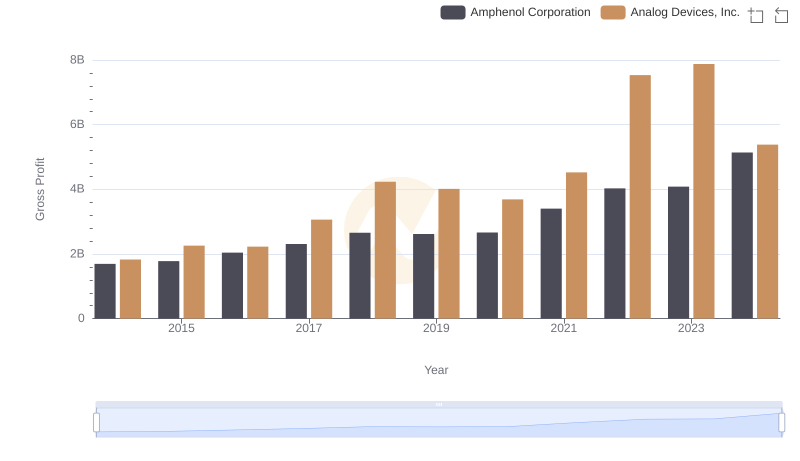
Who Generates Higher Gross Profit? Analog Devices, Inc. or Amphenol Corporation
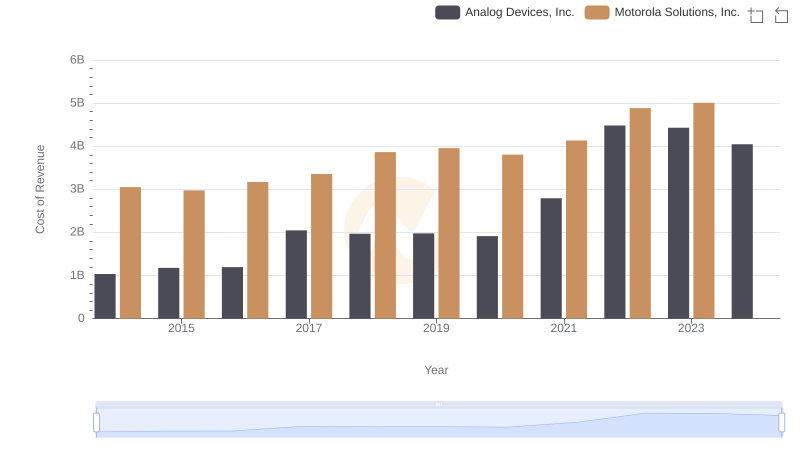
Cost of Revenue Comparison: Analog Devices, Inc. vs Motorola Solutions, Inc.
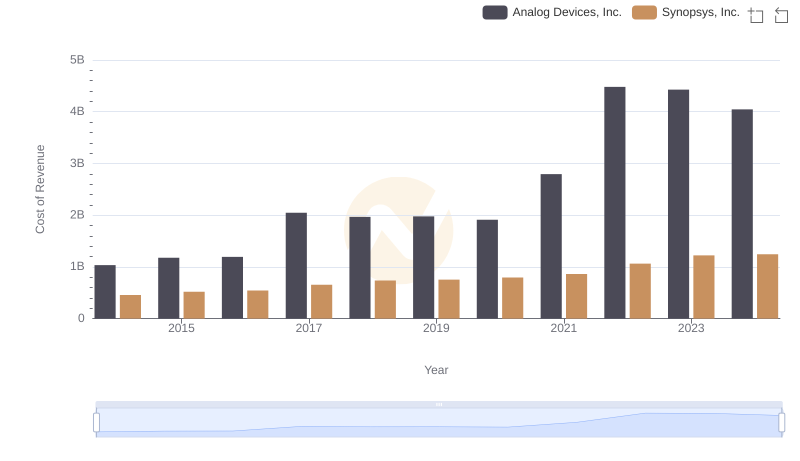
Analog Devices, Inc. vs Synopsys, Inc.: Efficiency in Cost of Revenue Explored
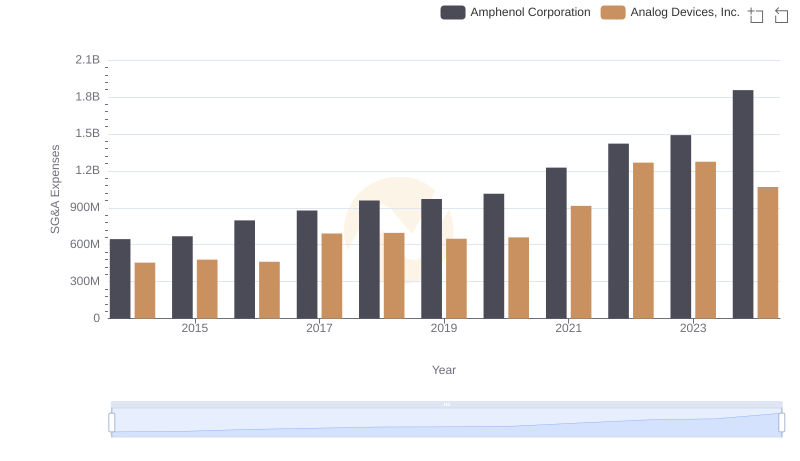
Operational Costs Compared: SG&A Analysis of Analog Devices, Inc. and Amphenol Corporation
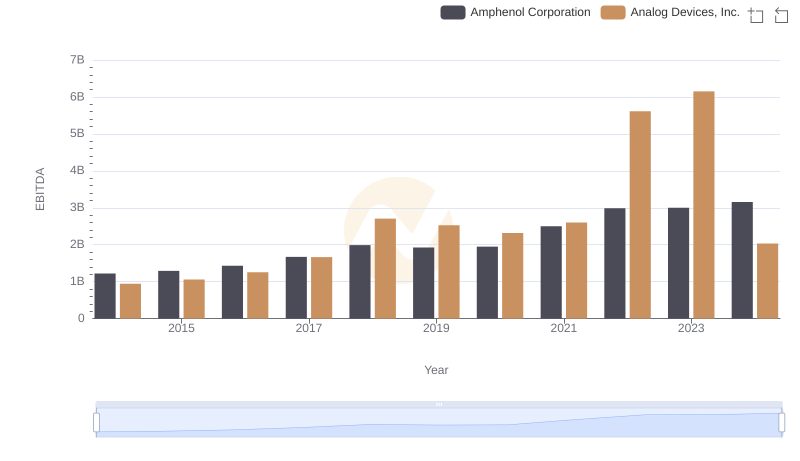
EBITDA Performance Review: Analog Devices, Inc. vs Amphenol Corporation