| __timestamp | C.H. Robinson Worldwide, Inc. | Lennox International Inc. |
|---|---|---|
| Wednesday, January 1, 2014 | 13470067000 | 3367400000 |
| Thursday, January 1, 2015 | 13476084000 | 3467400000 |
| Friday, January 1, 2016 | 13144413000 | 3641600000 |
| Sunday, January 1, 2017 | 14869380000 | 3839600000 |
| Monday, January 1, 2018 | 16631172000 | 3883900000 |
| Tuesday, January 1, 2019 | 15309508000 | 3807200000 |
| Wednesday, January 1, 2020 | 16207106000 | 3634100000 |
| Friday, January 1, 2021 | 23102138000 | 4194100000 |
| Saturday, January 1, 2022 | 24696625000 | 4718400000 |
| Sunday, January 1, 2023 | 17596443000 | 4981900000 |
| Monday, January 1, 2024 | 17724956000 | 5341300000 |
Unlocking the unknown
In the competitive landscape of the U.S. stock market, Lennox International Inc. and C.H. Robinson Worldwide, Inc. have showcased intriguing revenue trajectories over the past decade. From 2014 to 2024, C.H. Robinson's revenue surged by approximately 32%, peaking in 2022 with a remarkable $24.7 billion. Meanwhile, Lennox International demonstrated a steady growth of around 59%, reaching $5.3 billion in 2024.
C.H. Robinson's revenue saw a significant leap in 2021, jumping by 43% from the previous year, reflecting its robust market strategies. Lennox, on the other hand, maintained a consistent upward trend, with a notable 13% increase in 2023. These figures highlight the resilience and adaptability of both companies in navigating economic challenges and seizing market opportunities.
As we look to the future, these trends offer valuable insights into the evolving dynamics of the logistics and manufacturing sectors.
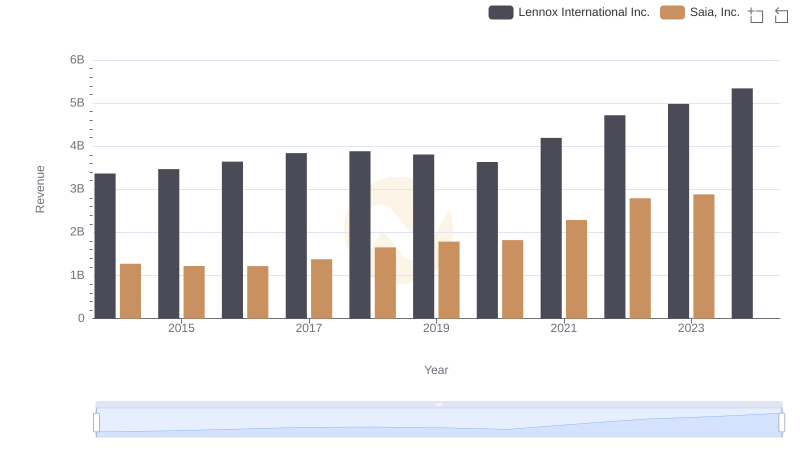
Revenue Insights: Lennox International Inc. and Saia, Inc. Performance Compared
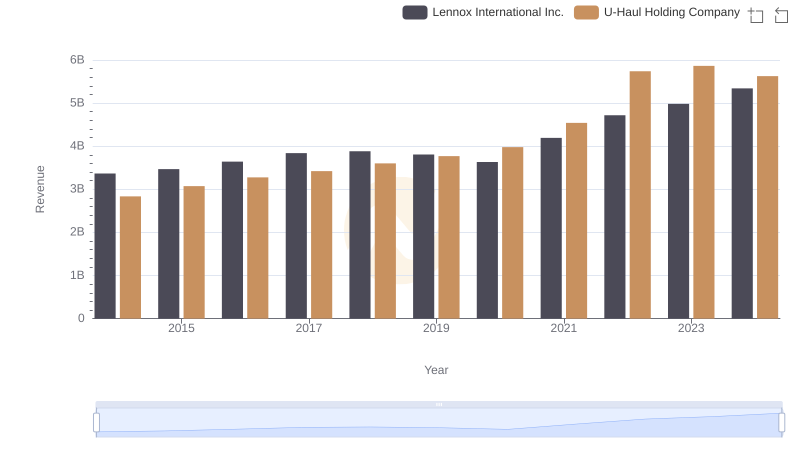
Lennox International Inc. and U-Haul Holding Company: A Comprehensive Revenue Analysis
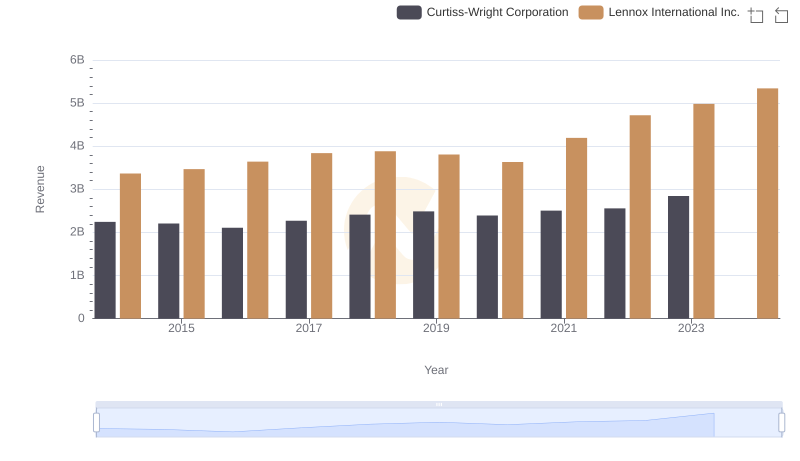
Revenue Showdown: Lennox International Inc. vs Curtiss-Wright Corporation
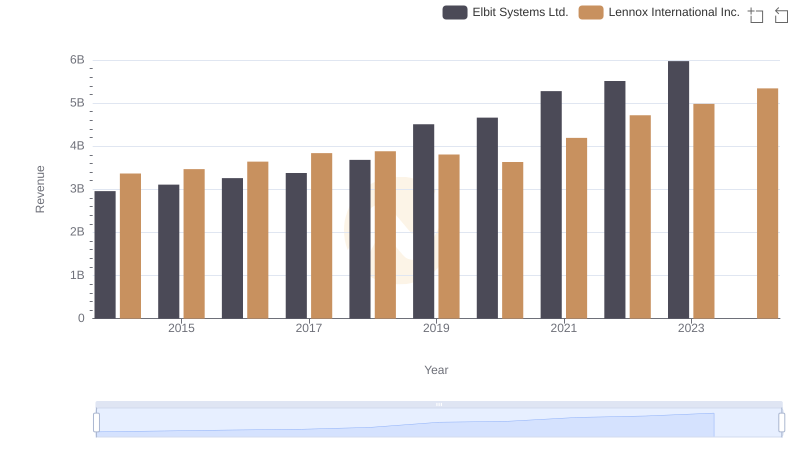
Lennox International Inc. or Elbit Systems Ltd.: Who Leads in Yearly Revenue?
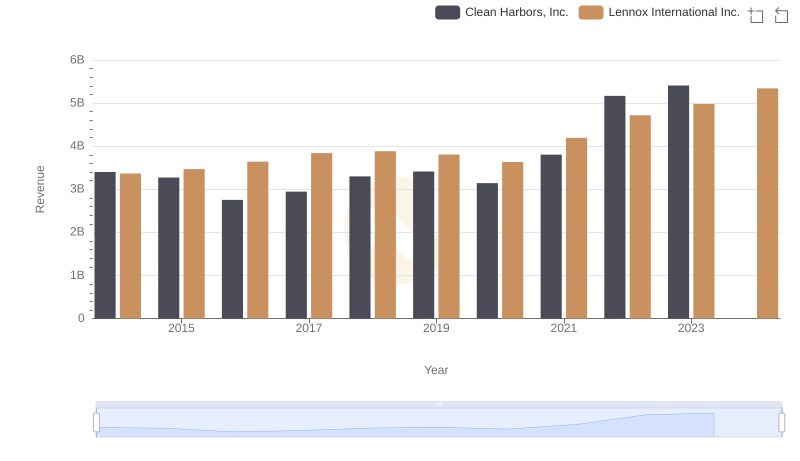
Comparing Revenue Performance: Lennox International Inc. or Clean Harbors, Inc.?
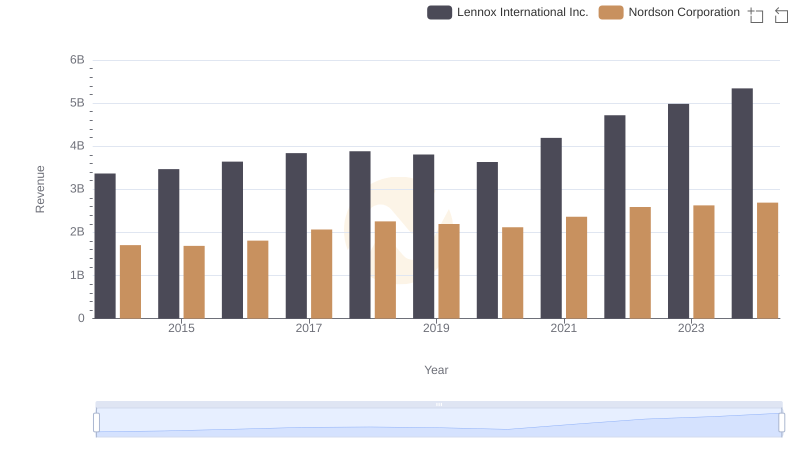
Revenue Showdown: Lennox International Inc. vs Nordson Corporation
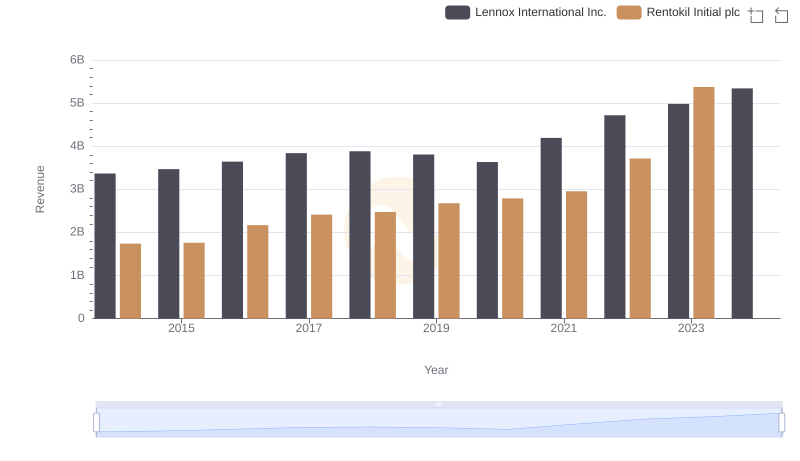
Annual Revenue Comparison: Lennox International Inc. vs Rentokil Initial plc
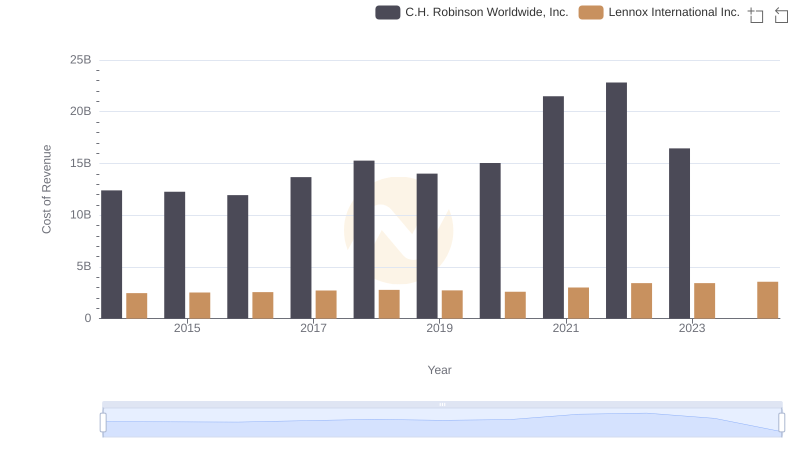
Cost of Revenue: Key Insights for Lennox International Inc. and C.H. Robinson Worldwide, Inc.
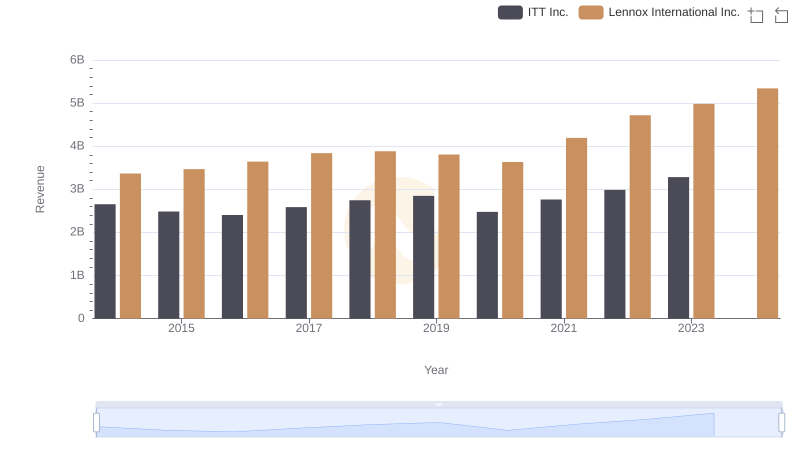
Annual Revenue Comparison: Lennox International Inc. vs ITT Inc.
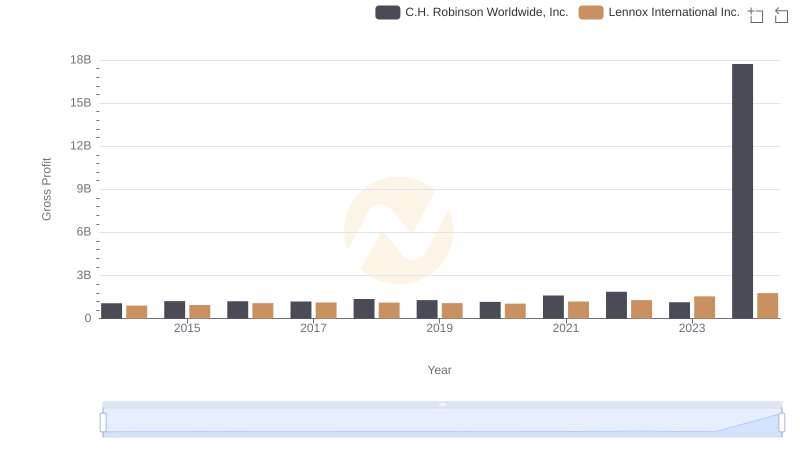
Gross Profit Analysis: Comparing Lennox International Inc. and C.H. Robinson Worldwide, Inc.
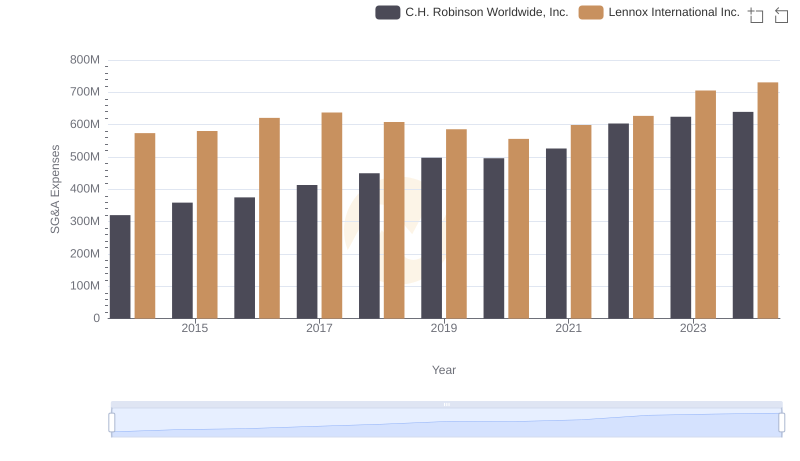
Comparing SG&A Expenses: Lennox International Inc. vs C.H. Robinson Worldwide, Inc. Trends and Insights
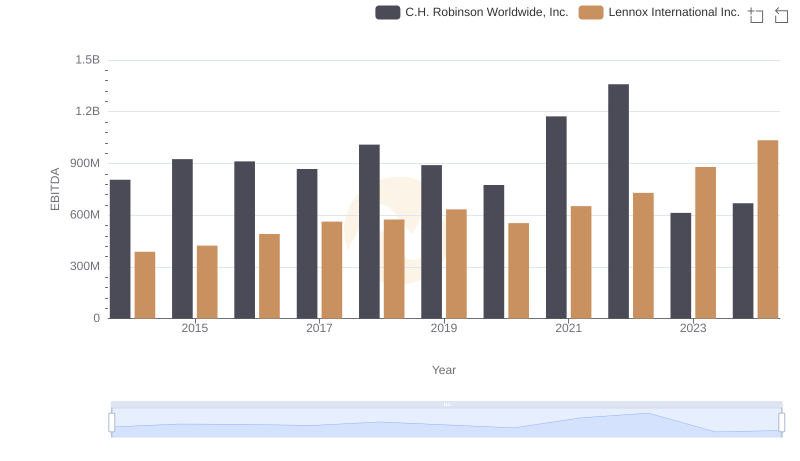
A Professional Review of EBITDA: Lennox International Inc. Compared to C.H. Robinson Worldwide, Inc.